
Quick Answer: Operational Dashboard Requirements Checklist
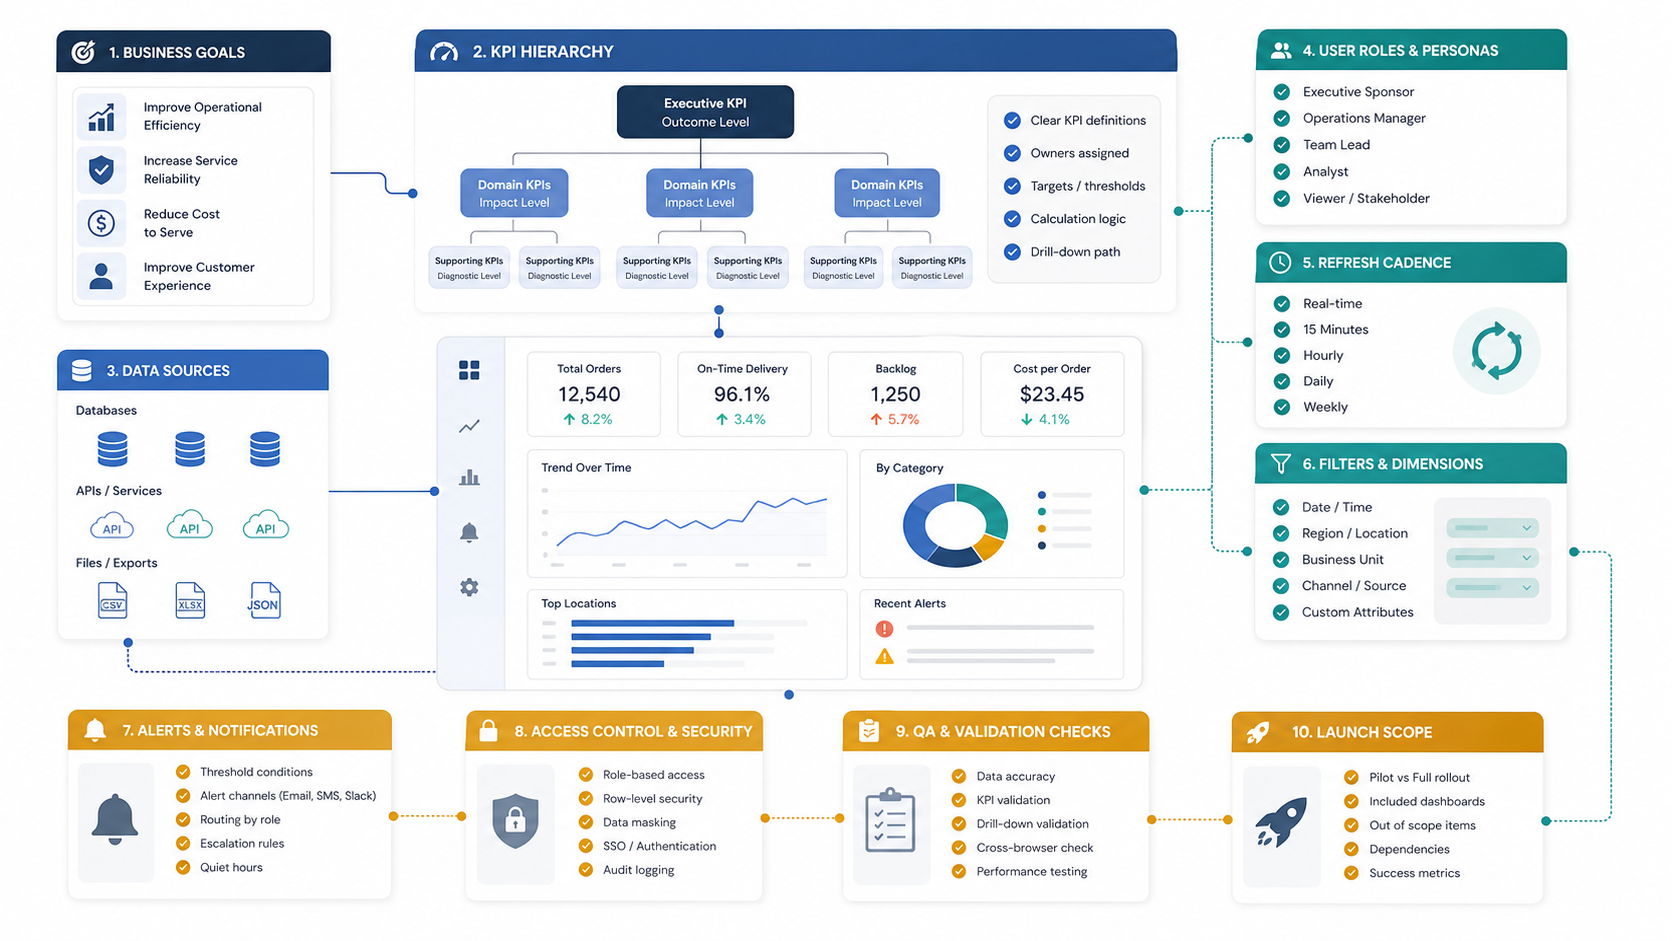
An operational dashboard requirements checklist should define the business decision the dashboard supports, the KPI hierarchy, source systems, data ownership, user roles, refresh cadence, filters, alerts, access rules, QA checks, launch scope, and post-launch review process. If those decisions are missing, the dashboard usually becomes a busy reporting screen instead of a tool that helps teams act faster. For teams that want this translated into a build plan, NextPage's custom dashboard development services connect requirements, integrations, permissions, QA, and rollout into one delivery scope.
The most useful dashboards are built around operating decisions: which bottlenecks need attention, which teams need follow-up, which queues are aging, which SLA is at risk, which region is slipping, which inventory or staffing issue needs action, and which owner can resolve it. Treat the dashboard as a workflow product, not as a chart collection.
If you are still estimating scope, use the MVP Scope Builder to separate launch-critical dashboard workflows from later reporting ideas. For budget framing, the Custom Software Cost Estimator can help you compare dashboard complexity, integrations, roles, and timeline before a detailed discovery call.
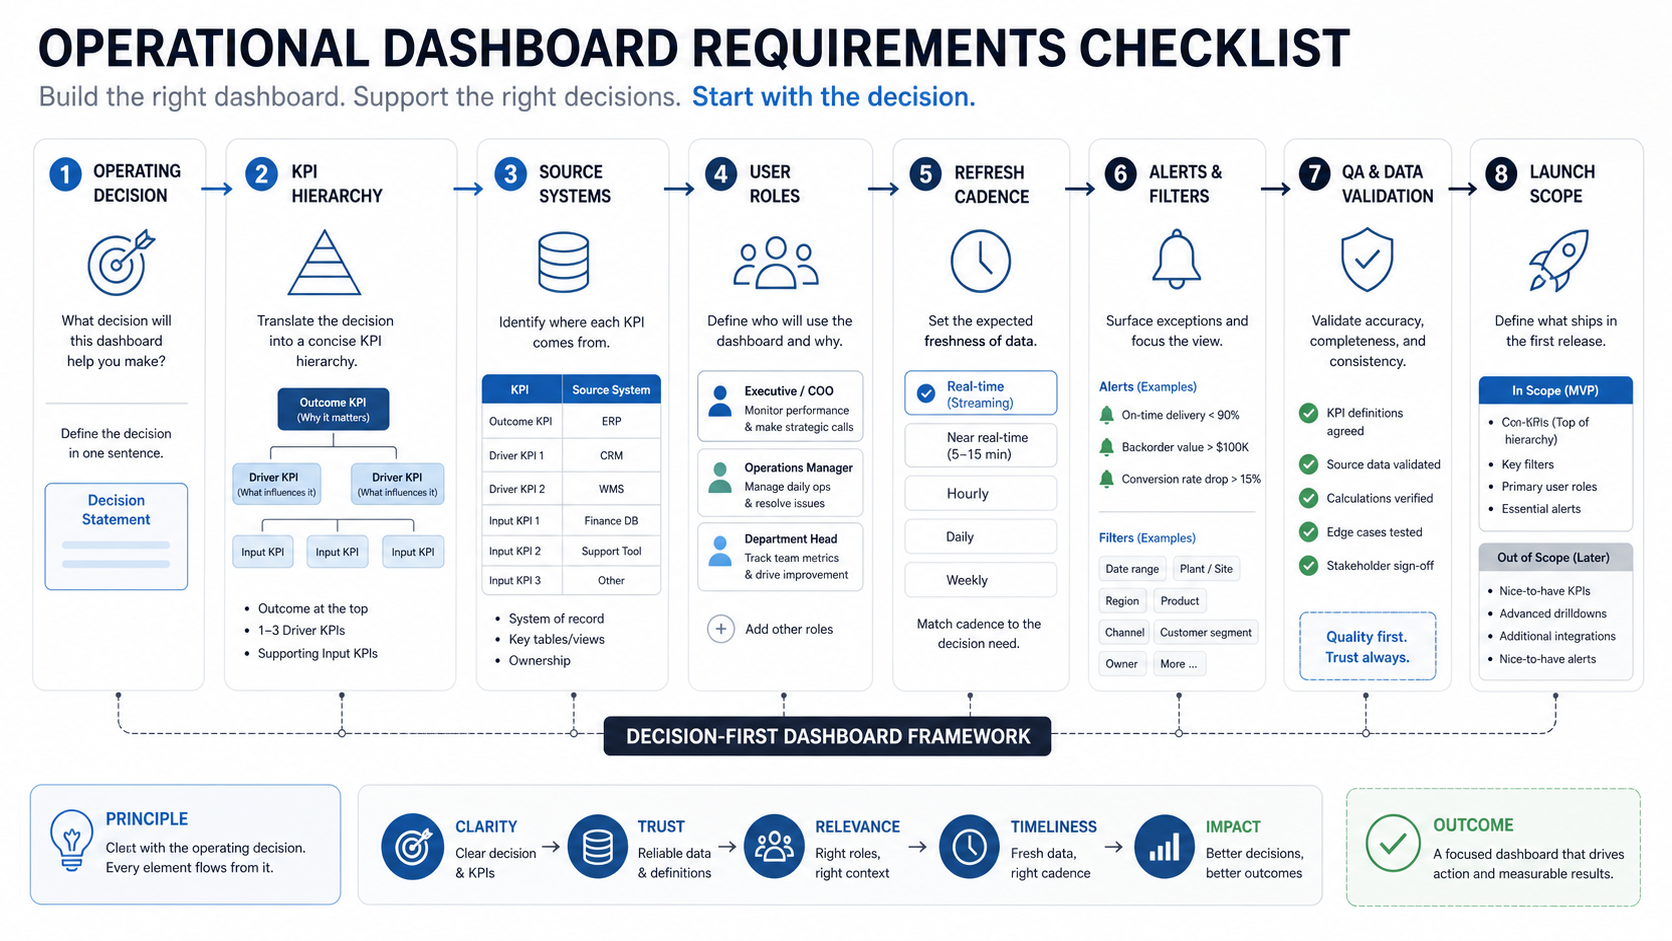
Start With The Operational Decision
Before listing charts, write the decisions the dashboard should improve. A sales dashboard may help leaders rebalance pipeline coverage. A support dashboard may expose aging tickets and SLA risk. A logistics dashboard may show delayed routes, exception clusters, and capacity gaps. A manufacturing dashboard may connect output, downtime, quality, and maintenance signals. If the dashboard needs workflow actions, admin settings, or customer-facing access, plan it as web app development for dashboards and business workflows, not just a reporting page.
Each dashboard view should answer three questions: what changed, why it matters, and who should act. If a chart does not support a decision, escalation, prioritization, forecast, or review meeting, it may belong in a separate report rather than the first dashboard release.
| Planning Question | Requirement To Capture | Why It Matters |
|---|---|---|
| What decision will improve? | Decision statement, meeting rhythm, target owner | Prevents chart-first scope creep |
| Which metric proves progress? | North-star KPI and supporting indicators | Keeps teams aligned on outcomes |
| Who can act on the signal? | Role, permission, escalation path | Turns visibility into action |
| How fresh must data be? | Refresh cadence and latency tolerance | Avoids overbuilding real-time pipelines |
Define The KPI Hierarchy
A strong operational dashboard separates outcome KPIs, control metrics, diagnostic metrics, and context metrics. Outcome KPIs show whether the business result is improving. Control metrics show whether the operating system is healthy. Diagnostic metrics explain why something changed. Context metrics prevent teams from misreading the number.
For example, a support dashboard might use customer satisfaction, SLA compliance, backlog age, first response time, reopen rate, staffing level, channel mix, and priority distribution. A single KPI card is rarely enough. Teams need enough surrounding context to know whether the issue is demand, staffing, quality, process, or data.
- Outcome KPIs: revenue, SLA compliance, delivery reliability, customer satisfaction, margin, conversion, throughput, or cycle time.
- Control metrics: backlog, utilization, queue age, error rate, on-time rate, capacity, open exceptions, or pending approvals.
- Diagnostic metrics: root-cause categories, region, team, source channel, product line, workflow step, or integration status.
- Context metrics: seasonality, volume, staffing, inventory, campaign activity, holidays, outages, or recent process changes.
When the dashboard is part of a larger custom workflow, the same cost drivers apply as broader custom software development cost: role complexity, integrations, data sensitivity, admin controls, and testing effort matter more than the number of visible charts.
Map Data Sources And Owners
Operational dashboards fail when nobody owns the data definition. List every source system, the fields required, the update method, the owner, the known quality issues, and the fallback plan when data is delayed. Common sources include CRM, ERP, help desk, billing, inventory, warehouse tools, spreadsheets, data warehouse tables, IoT streams, product analytics, and internal workflow systems.
For each metric, capture the source of truth. If sales uses one revenue number and finance uses another, the dashboard needs a documented definition before development starts. Do not hide metric disputes inside the UI; resolve them during requirements.
Also decide whether a BI tool, embedded analytics layer, or bespoke reporting portal fits the job. The tradeoffs in Power BI vs custom dashboard app planning are especially relevant when teams need governed metrics, operational drilldowns, permissions, and action workflows in one place.
| Data Requirement | What To Document | Example |
|---|---|---|
| Source system | System name, table/API/report, owner | CRM opportunities API owned by sales operations |
| Metric definition | Formula, filters, exclusions, timezone | SLA breach excludes tickets paused for customer response |
| Refresh method | Batch, webhook, streaming, manual import | Hourly warehouse sync plus manual exception upload |
| Data quality | Missing fields, duplicates, lag, validation rules | Orders without region should appear in a data-quality queue |
Define Users, Roles, And Permissions
A dashboard for executives, department heads, frontline managers, analysts, and operators should not show the same surface to everyone. Executives need summary trends and decision flags. Managers need team-level drilldowns. Operators need queues, exceptions, and next actions. Analysts need export, filters, and definitions.
Role planning should include read access, edit access, export rights, saved views, alert subscriptions, admin settings, and data visibility by region, business unit, customer, vendor, or project. If the dashboard includes sensitive financial, HR, customer, or operational data, permission rules are part of the first release, not a later polish item.
- Viewer roles: can inspect approved metrics, filters, and trends.
- Operator roles: can act on queues, mark exceptions, or update statuses.
- Manager roles: can compare teams, assign owners, and receive escalation alerts.
- Admin roles: can manage metric definitions, thresholds, users, and integrations.
- Analyst roles: can export data, inspect definitions, and validate anomalies.
If the dashboard is one screen inside a broader platform, plan it like web app development: authentication, authorization, audit trails, responsive layouts, admin flows, integrations, and QA all affect scope.
Choose Refresh Cadence, Alerts, And Filters
Real-time data is attractive, but it is not always useful. A warehouse operations board may need near-real-time updates. A finance dashboard may only need daily refresh after reconciliations. A leadership KPI dashboard may need weekly snapshots with locked definitions. Match freshness to the decision cycle.
Filters and alerts need the same discipline. Too many filters make every meeting argue about which view is correct. Too many alerts train users to ignore the dashboard. Define the default view, the approved filter set, the alert threshold, the alert owner, and the action expected after an alert fires.
| Dashboard Element | Good Requirement | Weak Requirement |
|---|---|---|
| Refresh cadence | Support queue updates every 15 minutes during business hours | Make it real time |
| Filters | Region, channel, priority, owner, customer tier | Add every possible filter |
| Alerts | Notify manager when priority backlog exceeds threshold for 2 hours | Alert when anything looks bad |
| Exports | CSV export for monthly ops review with applied filters noted | Export everything |
Plan Dashboard Layout And Drilldowns
Dashboard layout should follow attention priority. Put the operating status, highest-risk exceptions, and most important trend at the top. Place diagnostic detail below the summary. Keep secondary analysis, raw tables, and exports available without overwhelming the first screen.
Use drilldowns when they help users move from signal to action. A backlog card should open the aging queue. A revenue variance should open region, segment, or sales-stage detail. A quality metric should open defect categories and affected workflow steps. Avoid drilldowns that only reveal another decorative chart.
- First screen: health status, top KPIs, risk flags, and most urgent exceptions.
- Diagnostic layer: breakdowns by team, channel, region, product, workflow step, or customer group.
- Action layer: queues, owners, comments, assignment, status changes, or links to the source record.
- Governance layer: metric definitions, data freshness, permissions, exports, and audit notes.
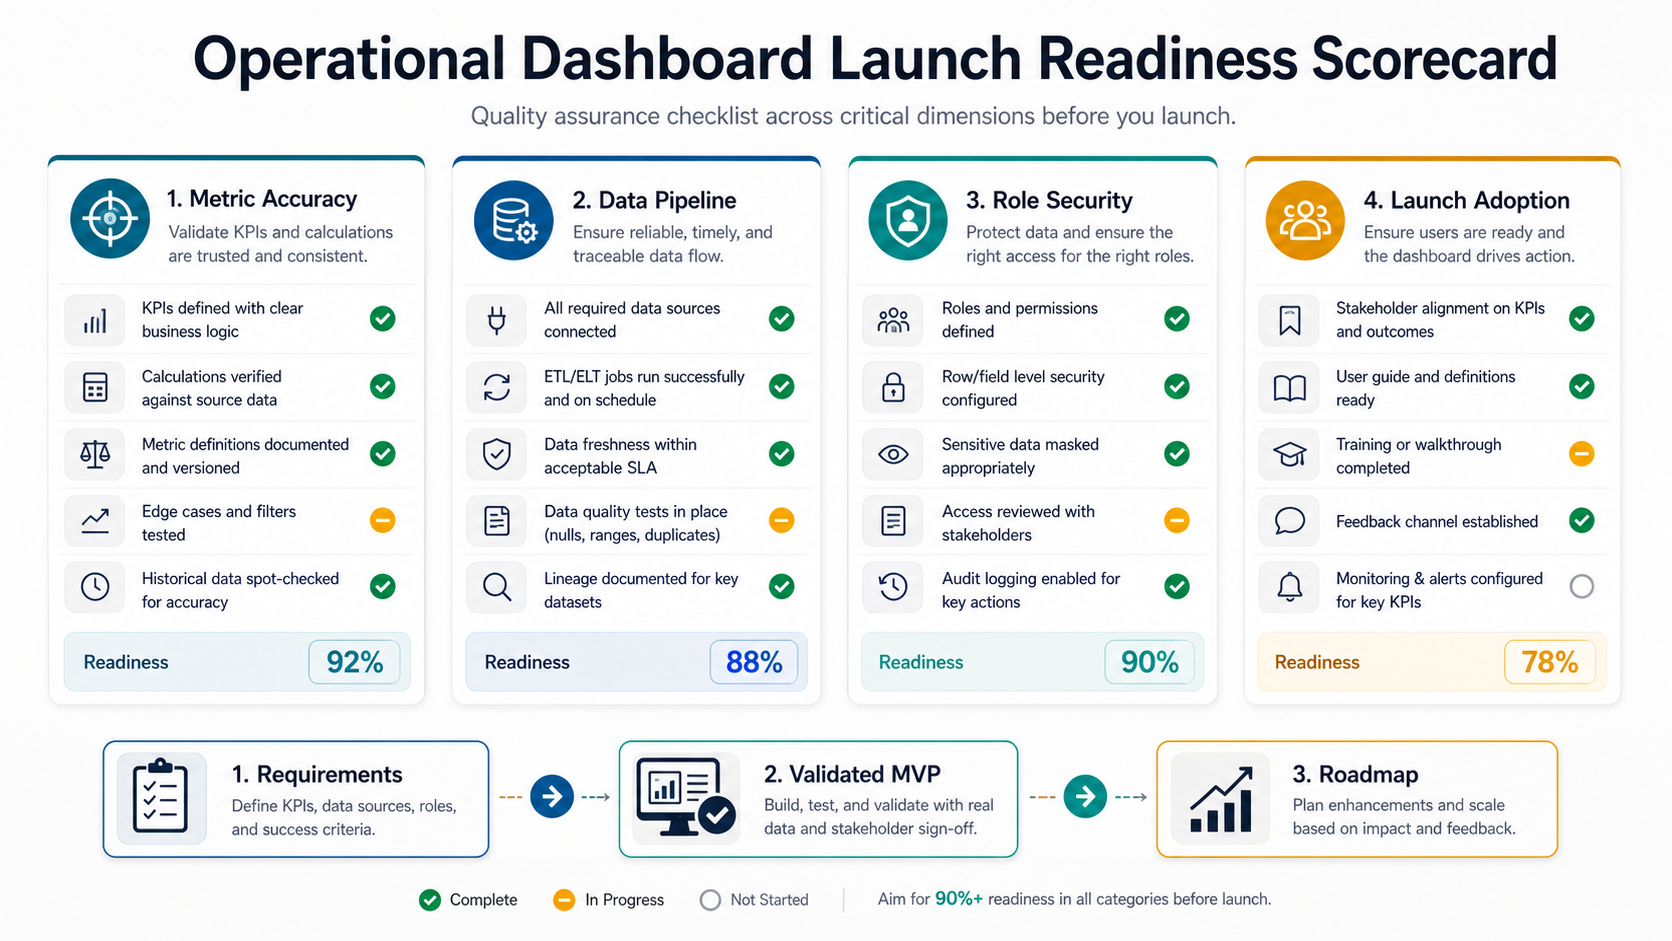
Prepare Quality Assurance Before Launch
Dashboard QA is not only visual testing. The team must test formulas, source data, permissions, filters, drilldowns, exports, responsiveness, alert logic, empty states, loading states, timezone behavior, and performance under realistic data volume. A dashboard that looks correct with ten sample rows can break when it receives a year of operations data. Use the same risk-first mindset as a test automation strategy for web apps: automate stable checks that protect business-critical decisions, and keep exploratory review for ambiguous metric behavior.
Test the dashboard against known reports before launch. If the dashboard replaces a spreadsheet or manual review pack, reconcile several historical periods. Document any intentional differences so teams do not lose trust on day one.
| QA Area | Checks |
|---|---|
| Metric accuracy | Formula, filters, date windows, timezone, exclusions, source reconciliation |
| Permissions | Role access, restricted fields, exports, admin controls, audit logs |
| Interaction | Filters, drilldowns, sorting, saved views, mobile behavior, empty states |
| Operations | Refresh failures, stale-data warnings, alert thresholds, support handoff |
Set The Launch Scope
The first release should focus on a narrow set of decisions and users. A good dashboard MVP might include one department, one operating cadence, five to eight critical KPIs, role-based access, core filters, one or two drilldowns, and a simple data-quality warning. Save predictive analytics, custom report builders, complex self-service configuration, and advanced alerts for later unless they are required for launch.
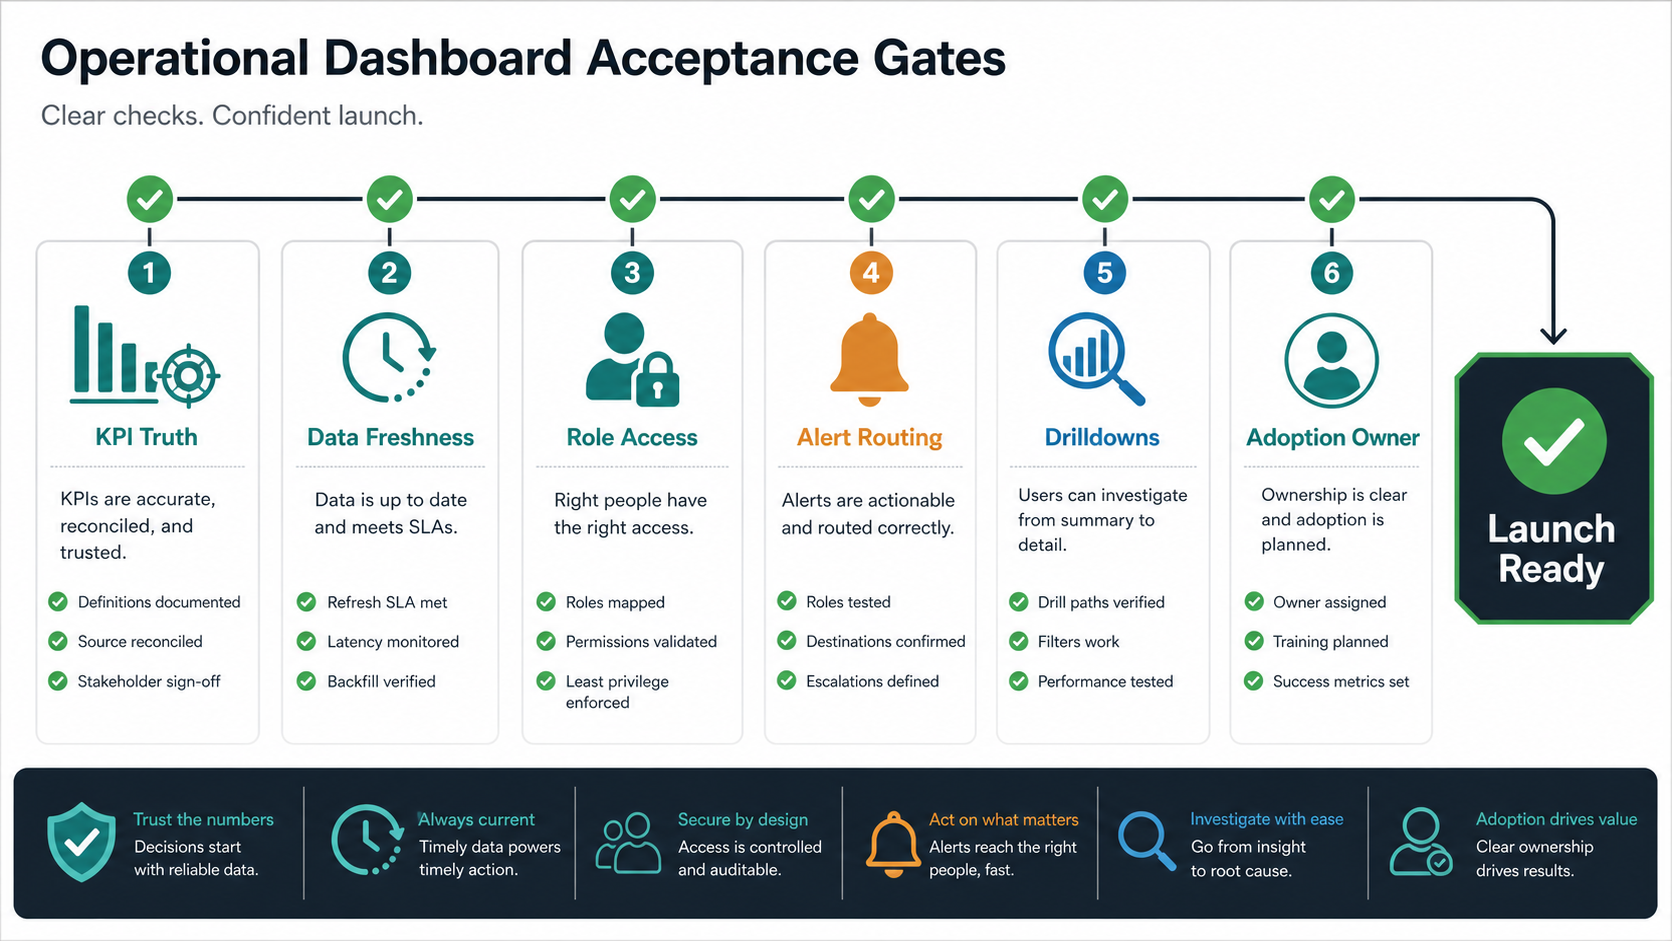
Use a launch readiness checklist before production release. If the dashboard will trigger escalations, approvals, or automated workflows, connect those handoffs to the same operating model you would use for AI automation services: named owners, fallback paths, audit evidence, and clear thresholds for human review.
- Decision owners agree on metric definitions and dashboard purpose.
- Source systems and data owners are documented.
- Roles, permissions, and export rules are approved.
- Refresh cadence and stale-data behavior are tested.
- Metric outputs reconcile with trusted historical reports.
- Alert owners understand what action to take.
- Support, feedback, and change-request channels are defined.
The right launch scope should make the dashboard useful immediately without pretending every reporting need has been solved. After launch, review usage, recurring questions, missed signals, and manual workarounds. That feedback becomes the roadmap. If the dashboard replaces spreadsheet handoffs or manual operational reviews, treat it like internal tool development: adoption, support ownership, permission changes, and workflow fit are part of the product, not post-launch cleanup.
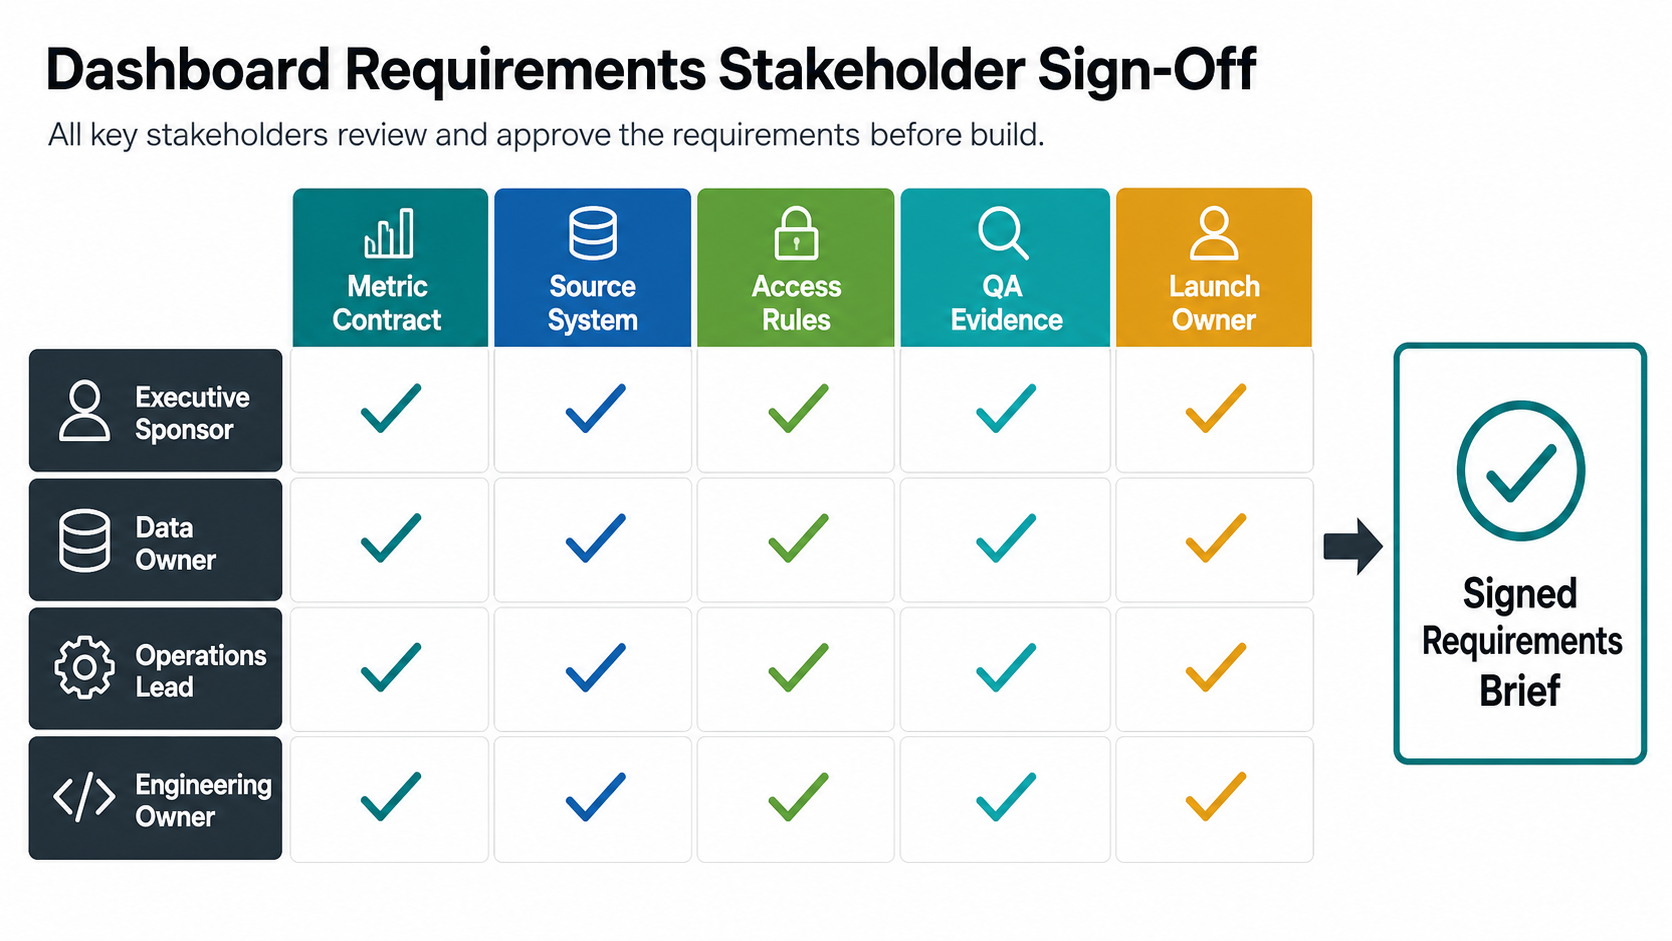
Turn The Checklist Into A Requirements Brief
A checklist is useful for discovery, but the development team needs a requirements brief that removes ambiguity. Before design or engineering starts, convert the answers into a short operating brief: the decision the dashboard supports, the primary users, the metric definitions, the source systems, the permission model, the refresh cadence, the launch workflow, and the acceptance tests that prove the dashboard is ready.
This brief should be specific enough for estimation. Instead of writing "show revenue by region," define the revenue source, booking rules, refund exclusions, timezone, region mapping, refresh window, user roles that can export the number, and the trusted report used for reconciliation. That level of detail prevents scope creep and protects trust after launch.
| Brief Section | Decision To Lock | Acceptance Evidence |
|---|---|---|
| Business decision | Which review, escalation, or operating action the dashboard improves | Named owner and meeting rhythm |
| Metric contract | Formula, filters, exclusions, timezone, and source of truth | Sample period reconciles with trusted reports |
| User model | Viewer, operator, manager, analyst, and admin permissions | Role-based access test cases pass |
| Data pipeline | Refresh cadence, stale-data handling, and failure alerts | Known delay and empty-state scenarios are tested |
| Launch scope | First users, first workflows, support owner, and feedback loop | UAT signoff and post-launch review date are scheduled |
Common Dashboard Requirements Mistakes
- Starting with chart types: bar charts and line charts do not matter until the team knows which operating decision needs support.
- Skipping metric definitions: undefined KPIs create trust problems when numbers differ from existing reports.
- Ignoring permissions: dashboards often expose sensitive customer, financial, employee, or vendor data.
- Overbuilding real-time data: low-latency pipelines add cost when decisions happen daily or weekly.
- Designing one view for every role: executives, managers, analysts, and operators need different levels of detail.
- No data-quality handling: users need to know when a source is stale, incomplete, duplicated, or manually overridden.
- No acceptance evidence: requirements should name the trusted reports, sample periods, role tests, and launch owners that prove the dashboard is ready for production use.
How NextPage Can Help
NextPage helps teams turn dashboard ideas into buildable requirements. We map decisions, KPIs, users, source systems, workflows, integrations, permissions, QA needs, and launch priorities before development starts. That keeps the first release focused on operational value instead of a long wishlist of charts, and it gives stakeholders a practical basis for estimating custom software development cost before build work begins.
If your team is planning an operational dashboard, start with the checklist above and identify the first decision the dashboard should improve. From there, NextPage can help shape the requirements, prototype the workflow, estimate the build, integrate source systems, test metric accuracy, and launch a dashboard that teams actually use in reviews and daily operations.