
Quick Answer: What Predictive Analytics Should Do For Insurers
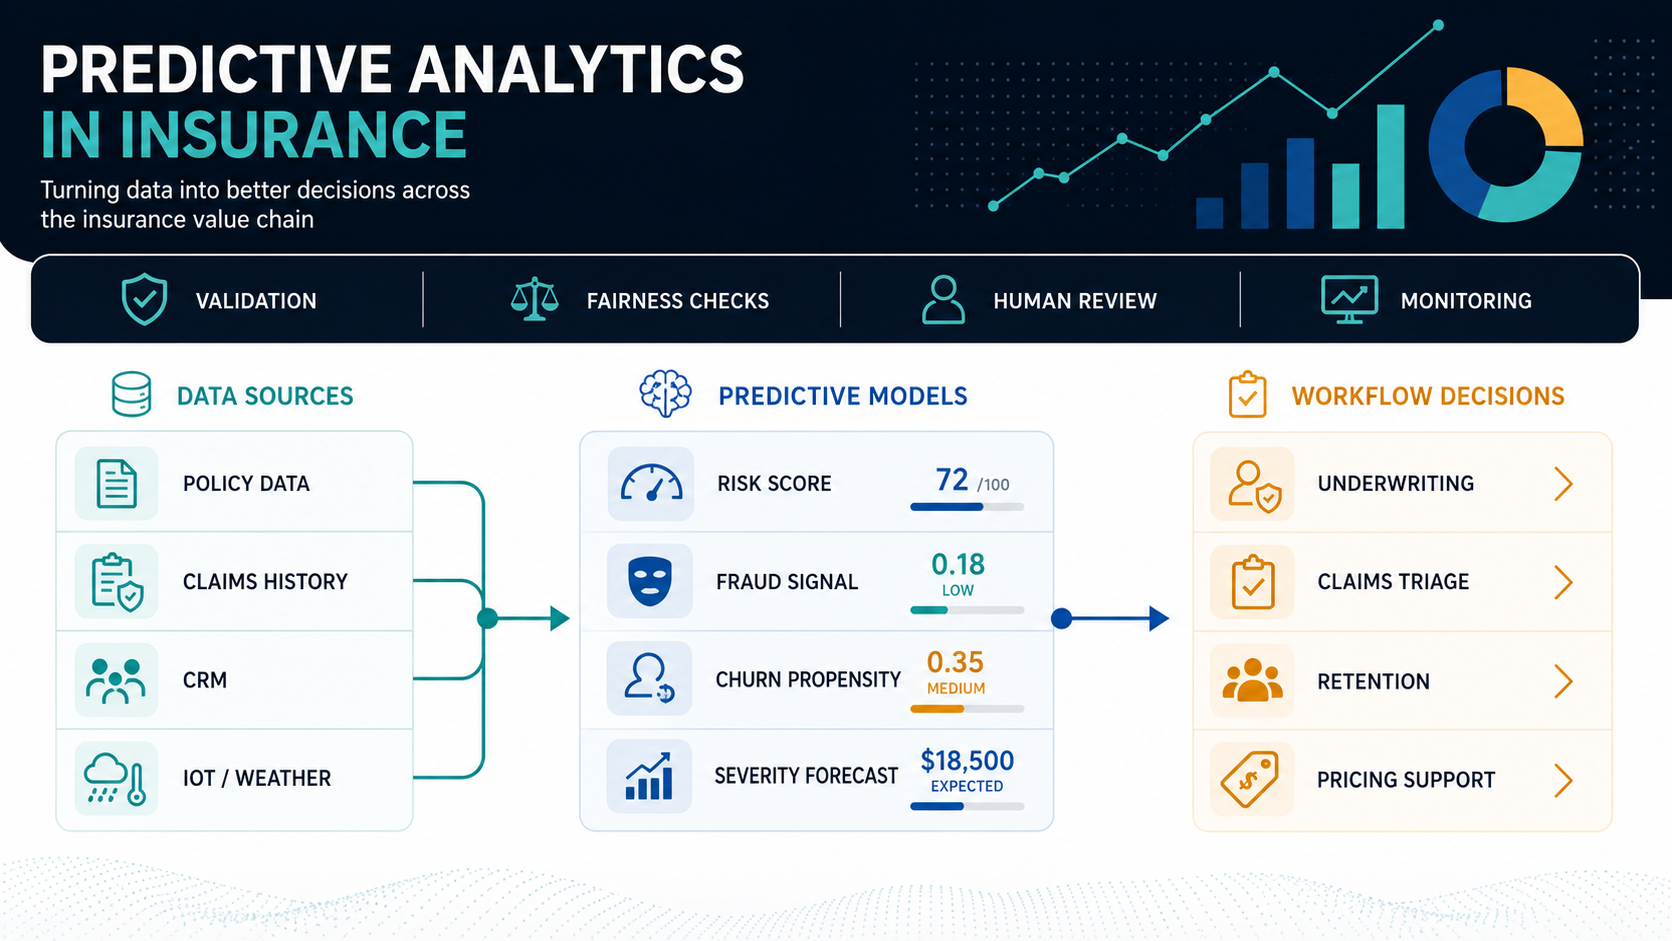
Predictive analytics in insurance uses historical, operational, behavioral, and external data to estimate what is likely to happen next: claim severity, fraud probability, underwriting referral risk, policyholder churn, premium adequacy, catastrophe exposure, or service demand. The practical goal is not to replace actuaries, underwriters, adjusters, or fraud investigators. The goal is to put a trusted signal in front of the right team early enough to improve a real decision.
The strongest insurance predictive analytics programs start with one workflow. A model that produces a beautiful score but does not change routing, review, pricing support, reserves, or customer outreach usually becomes another dashboard. A model connected to a claims queue, underwriting workbench, CRM journey, or fraud investigation process can reduce cycle time, improve review quality, and make risk decisions more consistent.
For most insurers, the practical sequence is: choose a narrow decision, prove the data is ready, build or adapt the model, design human review, set governance evidence, integrate the score into workflow software, measure the operational result, then scale only after monitoring proves the model is stable. If your team is still deciding whether the data and process are ready, NextPage's AI Agent Readiness Assessment is a useful first filter because predictive workflows have the same dependency on workflow clarity, data access, integrations, and human controls.
Start With Operating Decisions, Not A Model Inventory
Insurance teams often begin by listing every possible model: fraud detection, churn prediction, claim severity, risk segmentation, pricing support, customer lifetime value, lapse prediction, litigation risk, subrogation recovery, catastrophe exposure, and more. That inventory is useful, but it is not a roadmap. The roadmap should start with the decision that the business can change.
Ask four questions before approving any predictive analytics build:
- Who will use the prediction? Name the role: underwriter, claims handler, SIU analyst, pricing analyst, customer success team, branch manager, or operations lead.
- What action can change? Route, refer, approve, request evidence, prioritize outreach, change reserve review, escalate, suppress, or monitor.
- What evidence is available? Confirm historical labels, source-system access, permission boundaries, data lineage, and enough examples of both positive and negative outcomes.
- How will the team know it worked? Define cycle time, queue precision, loss leakage, investigation yield, retention uplift, claim outcome quality, or review consistency.
This is where machine learning development services should be more than model training. The valuable work is the operating design around the model: data contracts, evaluation sets, APIs, review states, monitoring, and decision logs.
Use-Case Matrix For Insurance Predictive Analytics
The best first use case depends on data maturity, workflow ownership, regulatory sensitivity, and the size of the decision. Claims triage might produce faster evidence because there are frequent events and clear queue outcomes. Underwriting models may have bigger strategic value but require tighter explainability, fairness review, and appetite alignment. Retention and product personalization can move quickly when CRM and policy history are clean, but weak consent and contact preferences can limit what the team can safely do.
| Use Case | Prediction Target | Data Needed | Human Control | Good First KPI |
|---|---|---|---|---|
| Underwriting support | Referral risk, missing evidence, appetite fit, risk tier | Submissions, policy data, loss history, exposure attributes, underwriting decisions | Underwriter approves, adjusts, or overrides recommendation | Review time, referral accuracy, exception quality |
| Claims triage | Severity, complexity, litigation probability, recovery opportunity | FNOL, claim notes, coverage, repair estimates, history, adjuster outcomes | Adjuster routes, reserves, escalates, or requests evidence | Cycle time, queue precision, leakage reduction |
| Fraud detection | Anomaly score, suspicious network, duplicate pattern, misrepresentation risk | Claims, policy history, documents, payments, entity links, investigation results | SIU reviews evidence before adverse action | Investigator hit rate, false-positive burden |
| Retention | Churn probability, renewal sensitivity, next best offer | Policy tenure, premium changes, claims experience, service history, CRM interactions | Service or sales team chooses outreach and message | Retention uplift, contact efficiency |
| Pricing and portfolio support | Expected loss, exposure trend, segment profitability | Claims, policies, external exposure data, actuarial assumptions, product rules | Actuarial and product review gates | Decision quality, monitoring stability |
For a broader view of adjacent insurance AI patterns, pair this guide with NextPage's article on AI in insurance use cases and implementation. That guide covers document extraction, assistants, claims workflows, and governance alongside predictive analytics.
Data Readiness Checklist Before Model Development
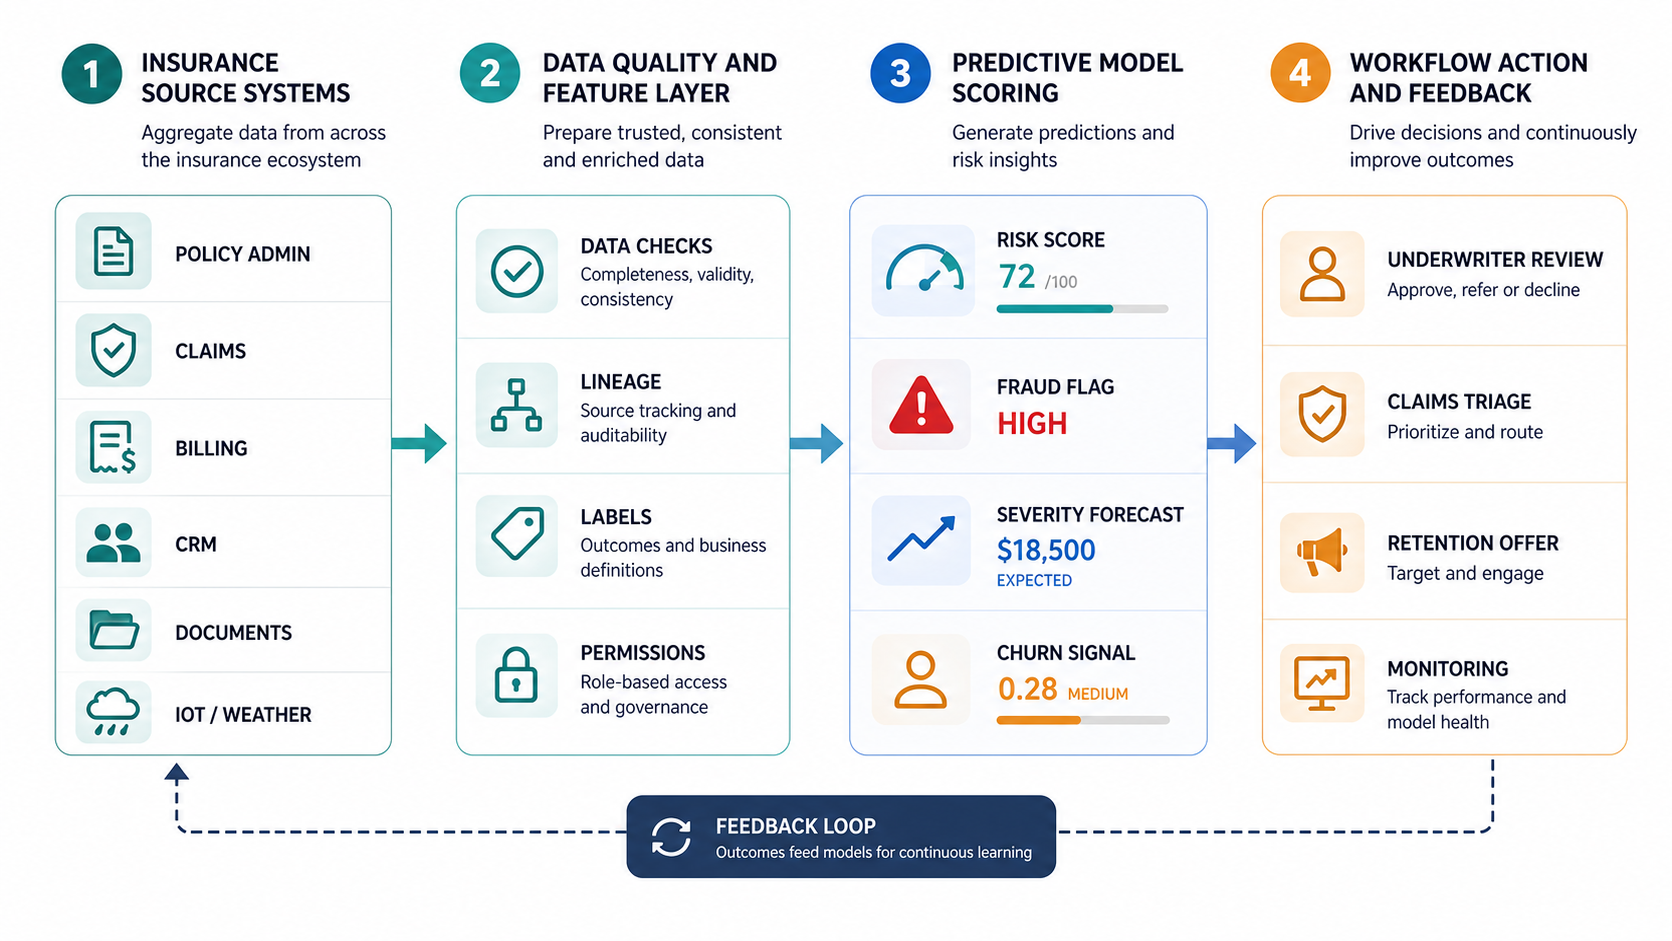
Predictive analytics fails most often because teams underestimate data work. Insurance data is usually distributed across policy administration, claims, billing, CRM, document management, data warehouses, spreadsheets, third-party feeds, and manual notes. A model can tolerate imperfect data, but a production workflow cannot tolerate unexplained data.
Before model development, confirm these checkpoints:
- Outcome labels: Define the event being predicted and the time window. Claim severity after 90 days is different from final paid severity. Churn risk before renewal is different from post-lapse explanation.
- Leakage review: Remove fields that reveal the future outcome, such as final payment values, investigation status, or post-decision notes that would not be available at scoring time.
- Lineage: Track which system owns each field, how it changes, and whether the model can use it in real time or only in batch scoring.
- Permissions and consent: Confirm whether the data may be used for the target decision and whether sensitive or protected attributes need special controls.
- Data quality thresholds: Set minimum completeness, freshness, duplication, and outlier rules before training.
- Segment coverage: Check whether small products, geographies, claim types, or customer groups have enough examples to support reliable scoring.
- Feedback capture: Ensure the workflow records the final action and outcome so the model can be evaluated after launch.
If the data picture is unclear, use an enterprise AI readiness checklist before committing to a production predictive analytics build. Readiness work may feel slower than a prototype, but it prevents the common pattern where a pilot model looks promising and then stalls because nobody can explain lineage, permissions, or monitoring ownership.
Model Options And When To Use Them
There is no single best model for insurance predictive analytics. The right pattern depends on explainability needs, data volume, update frequency, and the decision's risk level.
| Model Pattern | Useful For | Strength | Watch-Out |
|---|---|---|---|
| Rules plus scoring | Early fraud triage, referral criteria, eligibility checks | Easy to explain and govern | Can become brittle when patterns change |
| Regression and generalized linear models | Pricing support, severity estimates, retention propensity | Transparent and familiar to insurance teams | May miss nonlinear interactions |
| Tree-based machine learning | Claims severity, fraud flags, churn, underwriting triage | Strong tabular performance and feature importance options | Needs careful bias, drift, and calibration monitoring |
| Time-series forecasting | Claim volume, staffing, catastrophe response, demand planning | Good for operational capacity planning | Needs external-event handling and scenario review |
| NLP and document models | Claim notes, adjuster comments, submission documents, complaint themes | Unlocks unstructured evidence | Requires strong privacy, quality, and review controls |
| Graph and network analytics | Fraud rings, provider networks, entity linkage | Finds relationships hidden in individual records | Needs entity resolution and careful investigator workflow design |
Modern AI development services can combine these patterns with LLM-assisted document extraction or workflow automation, but predictive scoring still needs disciplined evaluation. Do not let a conversational interface hide whether the underlying prediction is calibrated, monitored, and reviewed.
Workflow Integration For Underwriting, Claims, Fraud, And Retention
A predictive score becomes valuable when it lands in the system where work already happens. That may be an underwriting workbench, claims platform, CRM, fraud investigation queue, internal dashboard, or custom workflow application. The integration should show the score, the reason codes or evidence summary, the recommended action, the confidence level, and the required human review state.
For claims, the score may route high-complexity files to senior adjusters, flag potential fraud for SIU, recommend early document requests, or prioritize files at risk of litigation. If claims operations are the first target, NextPage's insurance claims automation software checklist can help map the adjacent workflow, compliance, fraud-signal, and integration requirements.
For underwriting, predictive analytics can prioritize submissions, identify missing evidence, suggest referral paths, or highlight appetite mismatch. The system should never hide uncertainty. Underwriters need enough context to understand why the risk was flagged, what evidence is missing, and where they can override the recommendation with a reason.
For retention, predictive analytics can rank policyholders by lapse risk, but the business still needs a customer-safe action plan. Outreach should respect permissions, avoid unfair treatment, and distinguish between customers who need service recovery, price explanation, coverage education, or no contact at all.
If the core system cannot support these workflows cleanly, a custom operating layer may be better than forcing predictive analytics into a brittle spreadsheet process. NextPage's custom workflow software services are designed for this kind of role-based review, approval, exception, and reporting layer.
Governance And Release Gates For Predictive Models
Insurance predictive analytics affects decisions that can have consumer, financial, and regulatory consequences. Governance is not a final legal review after the model is built. It is an operating system around the model from discovery through production.
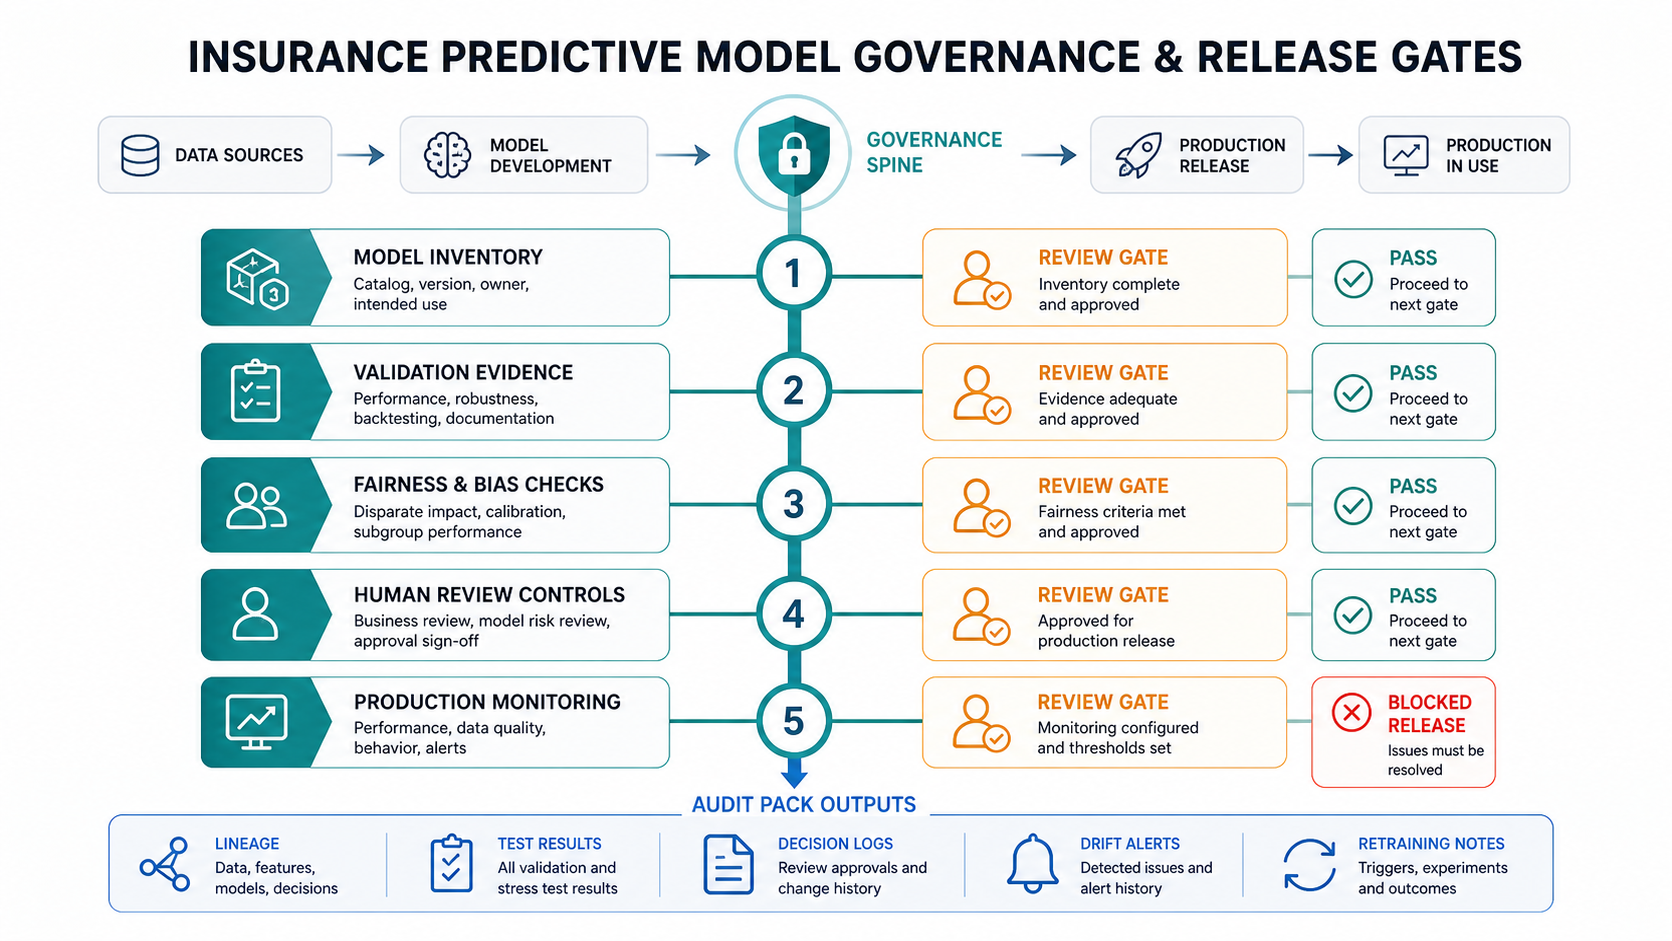
Use release gates that produce evidence, not just meeting notes:
- Model inventory: Record owner, use case, decision type, input data, model type, version, and intended users.
- Validation evidence: Keep training window, holdout results, calibration, robustness tests, segment performance, and known limitations.
- Fairness and bias checks: Test for disparate impact, proxy variables, subgroup performance gaps, and decision policies that require human review.
- Human review controls: Define when the system can recommend, when it must route, and when a person must approve or override.
- Third-party oversight: Document vendor data, external models, data rights, explainability limits, and monitoring responsibilities.
- Production monitoring: Track drift, calibration, volume shifts, override rates, false positives, false negatives, and business outcome changes.
- Audit pack: Preserve lineage, model cards, test results, decision logs, approval history, incident notes, and retraining records.
Recent NAIC guidance makes this discipline more important. The practical takeaway for product and technology teams is simple: if a model influences an insurance decision, the insurer needs a defensible program around accuracy, unfair discrimination risk, transparency, explainability, security, and oversight. Build those controls into delivery instead of treating them as paperwork at the end.
ROI Measurement And Operating KPIs
Predictive analytics ROI should be measured at the workflow level. A higher model AUC is useful, but the board will care about expense ratio, loss leakage, cycle time, conversion, retention, investigation yield, customer experience, and risk quality. Define baseline metrics before launch and separate model metrics from operating metrics.
| Workflow | Model Metric | Operating Metric | Financial Signal |
|---|---|---|---|
| Claims triage | Precision for high-severity or complex claims | Routing accuracy, time to first action, reserve review timeliness | Reduced leakage, lower handling cost, faster resolution |
| Fraud detection | Investigation hit rate and false-positive rate | SIU queue quality, investigator workload, time to evidence | Avoided loss and better investigator productivity |
| Underwriting support | Calibration by segment and referral accuracy | Submission cycle time, exception quality, underwriter adoption | Improved risk selection and faster quote response |
| Retention | Lift by risk decile | Targeted outreach completion and renewal movement | Retained premium and lower acquisition replacement cost |
For a quick business case, estimate the baseline volume, minutes saved, avoided loss, conversion uplift, retention value, and delivery cost. NextPage's AI Automation ROI Calculator can help structure the first pass before a deeper model-specific ROI plan.
Build, Buy, Or Hybrid: How To Choose
Insurance teams rarely need to choose between a completely custom model and a fully packaged analytics product. Many successful programs are hybrid: buy commodity capabilities, build differentiating models around proprietary data, and integrate both into controlled workflows.
Buy when the workflow is standard, the vendor has strong insurance-specific evidence, integration is straightforward, and the model does not need to encode a proprietary underwriting or claims advantage. Build when the data, decision logic, product design, or operating process is a differentiator. Use a hybrid approach when a vendor can accelerate document intake, entity resolution, fraud signals, or analytics infrastructure, while your team owns the final scoring, governance, and workflow action.
The deciding factor should not be only license cost. Evaluate data access, model transparency, audit support, customization depth, integration effort, monitoring, exit risk, and whether business teams can actually use the prediction in daily work.
Pilot-To-Production Roadmap
A practical insurance predictive analytics roadmap should move through controlled gates:
- Decision framing: Pick one workflow, one prediction target, one user group, and one success metric.
- Data audit: Validate labels, leakage, lineage, permissions, quality, and segment coverage.
- Prototype: Train a baseline model, compare it with rules or existing human process, and document limitations.
- Workflow design: Define score presentation, reason codes, review states, overrides, escalation, and feedback capture.
- Validation and governance: Complete performance, fairness, security, explainability, monitoring, and approval evidence.
- Limited release: Launch to a controlled team or product segment with manual review and daily monitoring.
- Scale decision: Expand only when model performance, operational adoption, and business KPIs support it.
- Continuous monitoring: Track drift, override rates, outcome quality, incidents, retraining triggers, and value realization.
Do not skip the limited release phase. Insurance workflows contain edge cases that are hard to discover in offline testing: unusual endorsements, incomplete documents, catastrophe spikes, legal exceptions, product-specific rules, and human override patterns. The first release should be narrow enough that the team can learn without creating unmanaged risk.
During the limited release, keep a weekly review rhythm that includes business owners, analytics, engineering, compliance, and the workflow team. Review score distribution, override reasons, missed cases, complaints, unusual segment behavior, and user adoption. A model that performs well offline can still fail if users distrust the explanation, if the score appears too late in the workflow, or if the team does not know what action to take. Treat these issues as product design problems, not only data science problems.
Also define retraining triggers before launch. Calendar-based retraining is not enough for insurance because claims mix, weather patterns, repair costs, fraud tactics, distribution channels, and product rules can shift quickly. Good triggers include sustained drift in input fields, calibration decay, a sharp change in override rates, new regulatory or underwriting policy requirements, and a meaningful gap between expected and observed business outcomes.
How NextPage Can Help
NextPage helps insurance, financial services, and enterprise teams turn predictive analytics ideas into production software. That can include data-readiness assessment, model development, workflow integration, dashboard and API design, human-review controls, monitoring, and custom applications around legacy core systems.
If the use case is ready for modeling, start with the data and decision workflow. If the workflow is still fragmented, start by designing the operating layer. If ROI is unclear, build a small measurement plan before committing to a large analytics platform. The right path is usually a narrow, governed first release that proves value and gives the organization confidence to scale.