
Quick Answer: SRE Observability Roadmap
An SRE observability roadmap is a practical plan for turning production signals into reliability decisions. It should define the user journeys that matter, service-level indicators, service-level objectives, error budgets, telemetry coverage, alert ownership, incident response roles, runbooks, post-incident learning, reliability backlog ownership, and leadership reporting.
The roadmap should not start with another dashboard purchase. It should start with the operating model: what the team promises users, what signals prove those promises are healthy, who responds when risk rises, and how recurring incidents become funded engineering work. NextPage frames this as practical DevOps consulting services plus reliability engineering, cloud operations, and internal workflow design.
For most teams, the first useful release is a narrow reliability loop for one or two critical services. Map the user journey, instrument the path, define a small SLO set, remove noisy alerts, practice incident response, and publish a monthly reliability scorecard before scaling across every service.

Why Observability Needs An Operating Roadmap
Many teams already have metrics, logs, traces, uptime checks, cloud dashboards, application error tracking, and incident notifications. The issue is that those signals often sit in disconnected tools, owned by different teams, with unclear thresholds and weak escalation paths. When production gets noisy, more data does not automatically create better reliability.
An operating roadmap forces the team to answer reliability questions before tool questions. Which customer journeys matter most? Which services support them? Which failures deserve a page? Which dashboards support engineers, support, product, and executives? Which recurring incidents deserve capacity in the next sprint?
Google SRE guidance treats service-level objectives and error budgets as mechanisms for balancing reliability and delivery speed. OpenTelemetry guidance reinforces that observability depends on consistent signals across metrics, logs, traces, and context propagation. DORA research continues to connect software delivery performance, reliability, and organizational outcomes. The article uses those sources as guidance, then translates them into a NextPage implementation plan.
Start With SLOs, Error Budgets, And Ownership
Site reliability engineering starts by making reliability explicit. Service-level objectives turn a vague target like "keep the platform stable" into measurable promises such as checkout availability, API latency, payment success, message delivery, data freshness, or batch job completion time.
| Reliability Layer | Question To Answer | Example Output |
|---|---|---|
| User journey | What must work for customers? | Login, checkout, booking, report generation, onboarding, or data sync |
| Service-level indicator | What signal measures that journey? | Availability, latency percentile, error rate, freshness, durability, or queue delay |
| Service-level objective | What target is good enough? | 99.95 percent checkout success, p95 API latency under 300 ms, or jobs completed within 10 minutes |
| Error budget | How much failure can the team absorb? | Budget burn guides release pace, risk acceptance, remediation, and customer communication |
| Owner | Who acts when the target is at risk? | Named service team, escalation contact, product owner, and decision cadence |
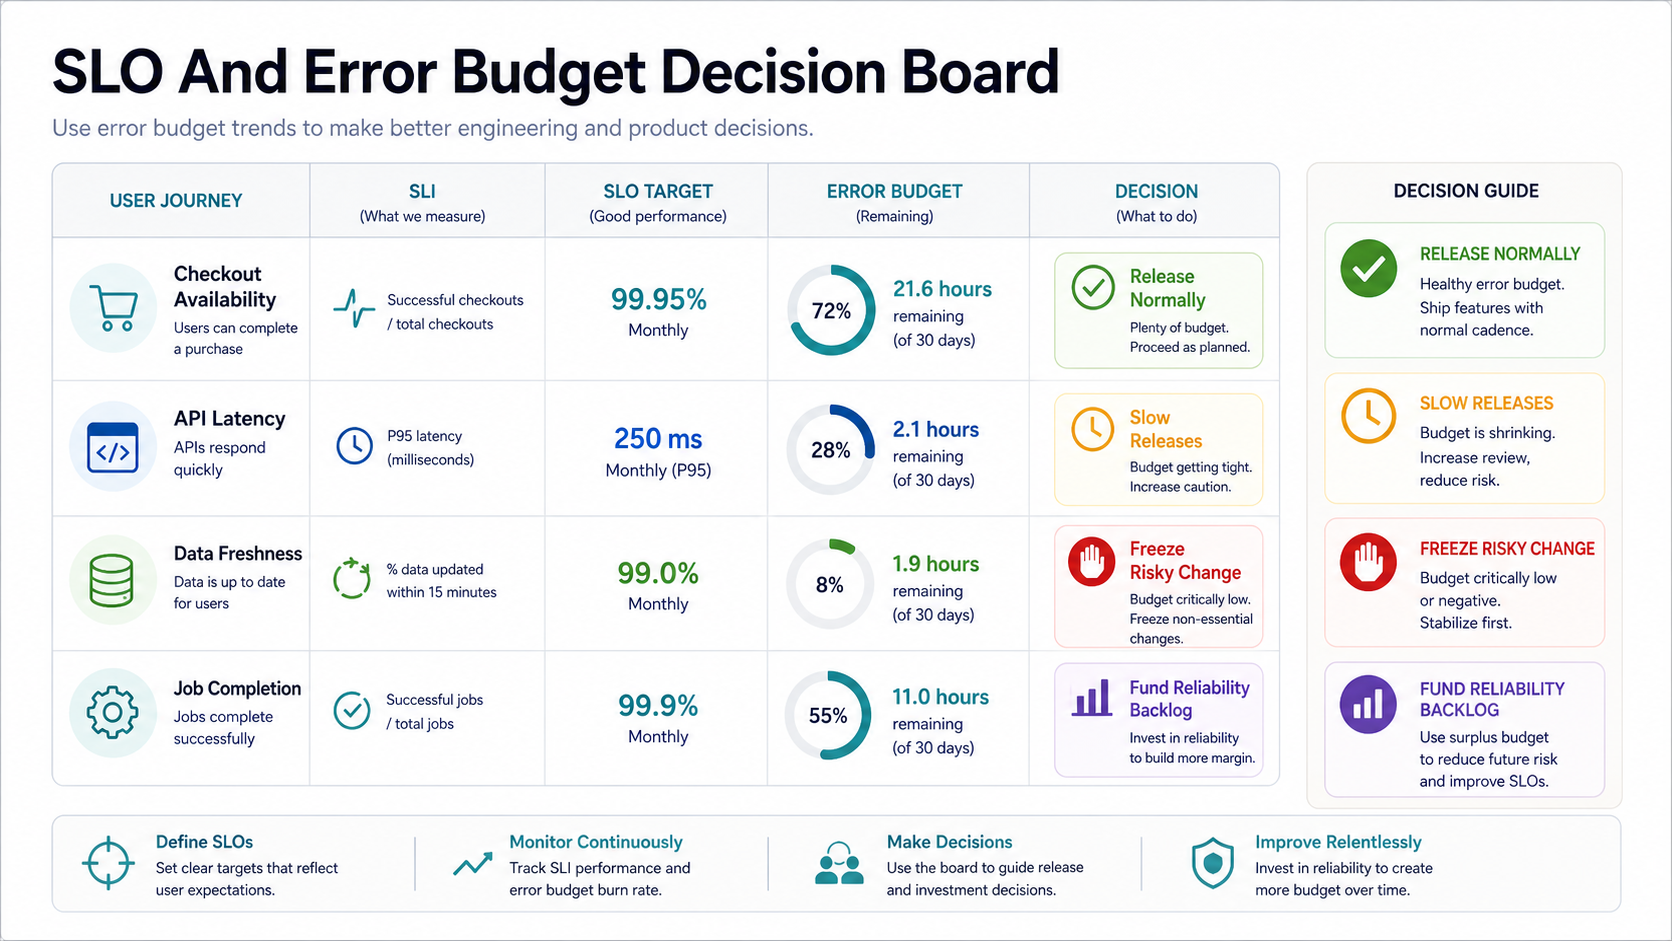
This ownership step matters. A dashboard without an owner becomes a wall display. An SLO with an owner becomes a decision mechanism for release timing, technical debt, capacity planning, and customer communication. Teams that need delivery and reliability improvements together can use the supporting guide to DevOps consulting for SaaS teams.
Build A Telemetry Architecture That Teams Can Trust
Observability depends on correlated telemetry. Metrics show system shape and trends. Logs explain events. Traces connect user actions across services. Events and deployment markers explain what changed. A roadmap should define the minimum useful telemetry for priority journeys before trying to cover every component.
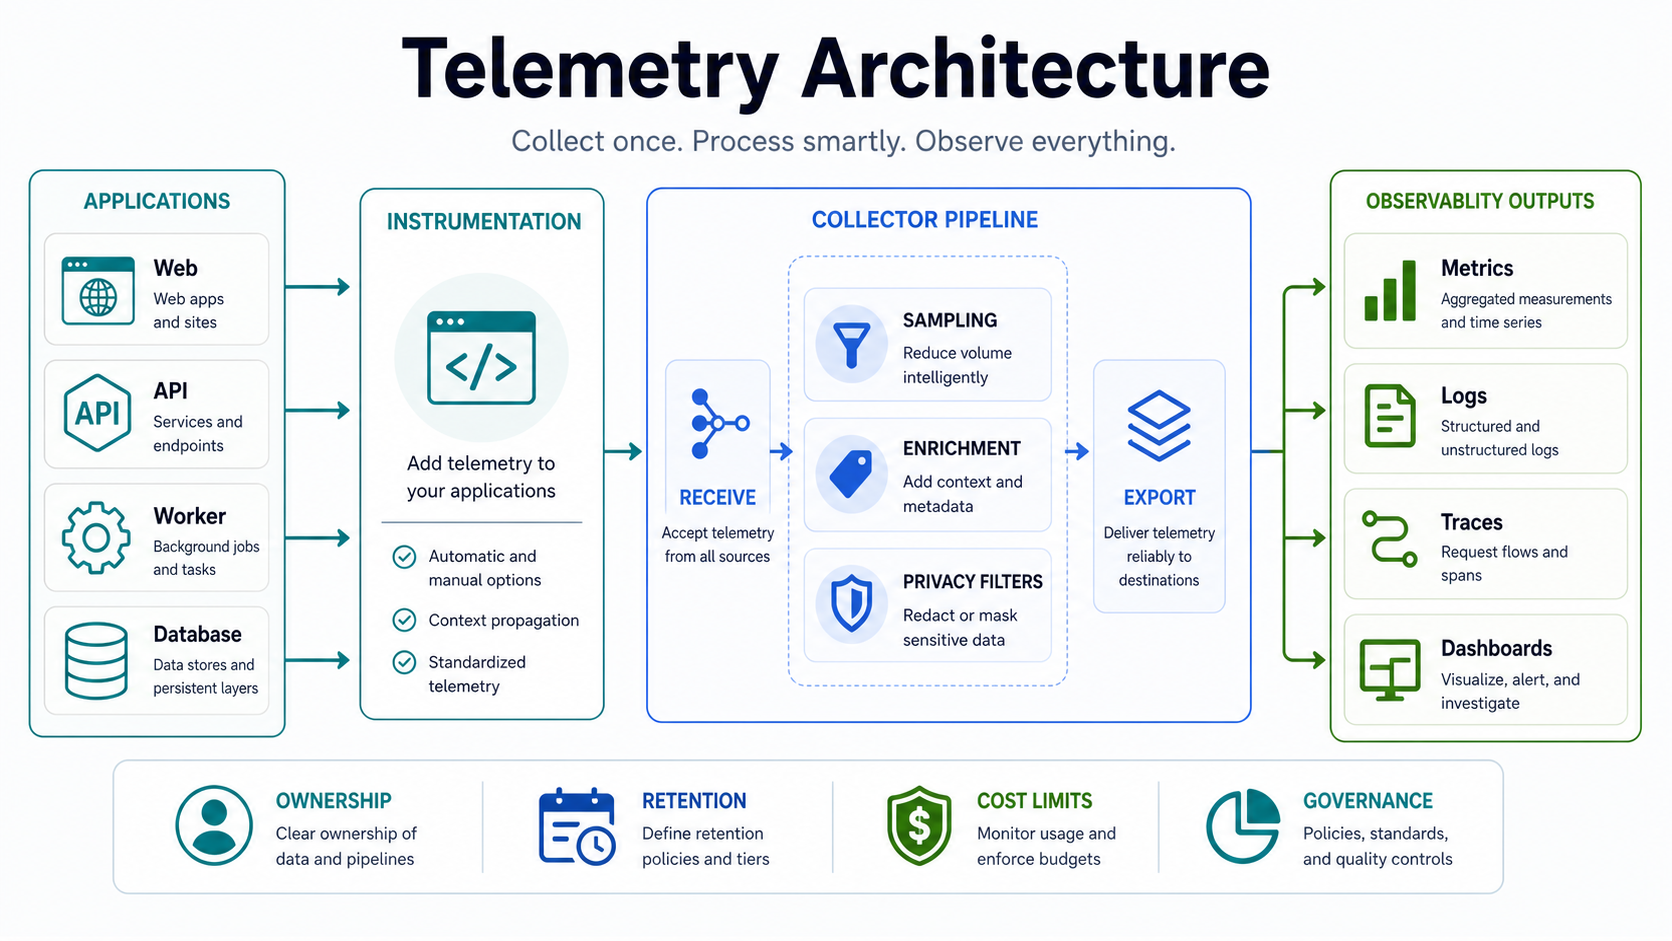
- Metrics: request rate, error rate, duration, saturation, queue depth, dependency health, job completion, and business-critical counters.
- Logs: structured events with request IDs, user-safe context, error classes, version markers, and privacy controls.
- Traces: cross-service transaction paths that reveal slow dependencies, retries, timeouts, and failure propagation.
- Synthetic checks: controlled probes for critical paths that may not receive constant real traffic.
- Real-user signals: frontend performance, browser errors, geography or device patterns, and conversion-impacting failures.
Cloud and infrastructure choices shape this foundation. If teams are also moving workloads, observability belongs in the cloud landing zone, deployment pipeline, access model, and cost controls. The NextPage cloud migration services page is a useful planning reference, and teams dealing with latency or scale issues should also review cloud performance optimization services.
Turn Alert Noise Into Actionable Reliability Signal
Alert fatigue is usually a design problem. Alerts fire because a metric changed, not because a user-facing reliability target is in danger. Teams then learn to ignore the alert stream, which makes real incidents harder to detect.
A useful page has a clear symptom, owner, urgency, runbook, escalation path, and recovery expectation. It should tell the on-call engineer what user impact might exist and what first action to take. Low-value alerts should become dashboards, weekly review items, or backlog signals instead of waking someone up.
| Alert Type | Keep As Page? | Better Treatment |
|---|---|---|
| User-facing outage or severe SLO burn | Yes | Page the primary owner with a runbook and escalation path |
| Single dependency warning | Maybe | Page only if it threatens an SLO or matches a known failure pattern |
| Capacity trend | No | Dashboard, review cadence, and planned backlog item |
| Repeated flaky signal | No | Fix instrumentation, threshold, ownership, or sampling |
Release pipelines also protect reliability. Security scans, change controls, environment parity, and release gates reduce avoidable production risk. For teams improving delivery quality alongside observability, the DevSecOps pipeline checklist is a useful supporting read.
Design The Incident Response Operating Model
Incident response should be practiced before a major outage. The workflow needs roles, routing, communication templates, runbooks, severity levels, customer-impact language, rollback criteria, and post-incident review habits.
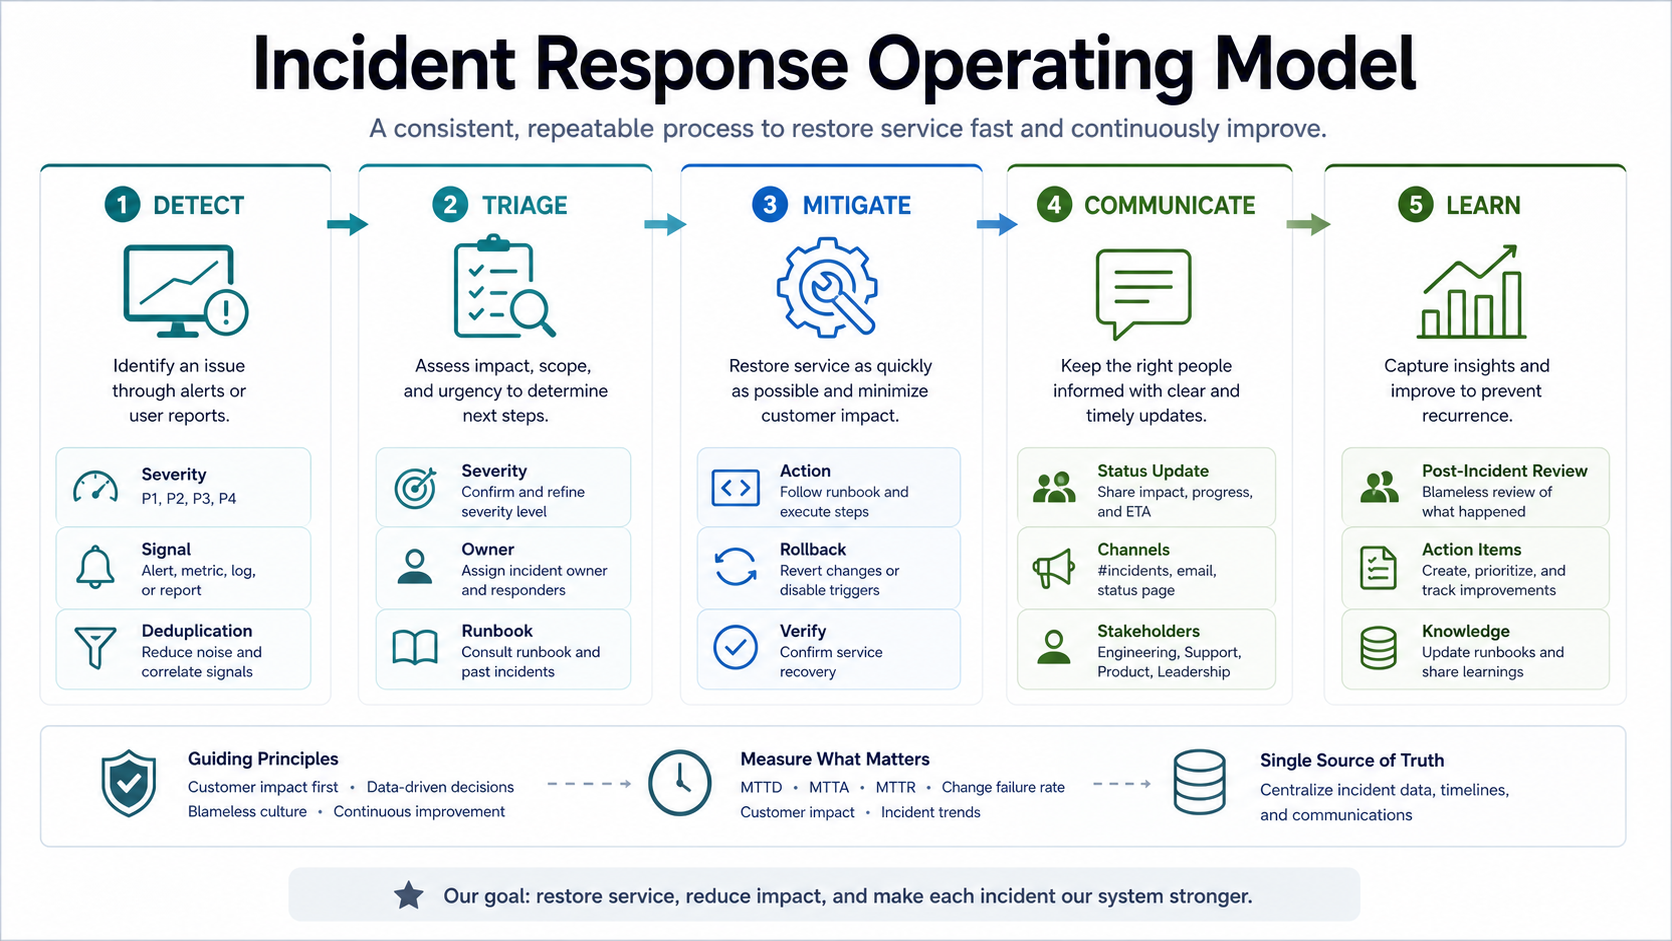
- Detection: alerts, synthetic checks, customer reports, support signals, and business metric anomalies.
- Triage: severity classification, affected services, customer impact, owners, and immediate containment.
- Mitigation: rollback, feature flag disablement, capacity changes, dependency fallback, queue drain, or hotfix.
- Communication: internal updates, customer-facing updates, support scripts, and leadership briefings.
- Learning: blameless review, contributing factors, action items, and reliability backlog prioritization.
Some incident tasks can eventually be automated with scripts, workflow engines, or AI-assisted triage. Treat that as IT process automation: automate repeatable steps after the process and ownership are understood.
A 90-Day SRE And Observability Roadmap
Most teams should begin with one or two critical products or services. The goal is to establish a repeatable pattern before scaling observability and SRE practices across the whole platform.

| Phase | Focus | Deliverables |
|---|---|---|
| Days 1-15 | Reliability discovery | Critical journeys, current incidents, top services, owner map, tool inventory |
| Days 16-35 | SLO and telemetry baseline | SLIs, initial SLOs, telemetry gaps, log/tracing standards, dashboard cleanup list |
| Days 36-55 | Alert and incident workflow | Alert review, routing rules, severity model, runbook templates, escalation plan |
| Days 56-75 | Reliability backlog | Prioritized remediation, capacity plan, release-risk controls, dashboard reporting |
| Days 76-90 | Operating cadence | Game day, incident review cadence, monthly reliability report, next-quarter roadmap |
This roadmap should connect to delivery operations. If releases are slow, hotfixes are stressful, and environments drift, observability work will expose the pain but not remove it. Pair SRE planning with CI/CD, cloud, and infrastructure improvements when needed.
Reliability Dashboards Leaders Can Actually Use
Reliability dashboards should separate operational detail from leadership signal. Engineers need drill-down views for traces, logs, deploys, dependencies, and runbooks. Leaders need service health, SLO burn, incident trends, customer impact, remediation progress, and capacity decisions.
The NextPage guide to an operational dashboard requirements checklist is relevant because reliability reporting is a dashboard design problem as much as a monitoring problem. Define KPI hierarchy, data sources, roles, freshness, and decision cadence before building another wall of charts.
| Audience | Needs To See | Decision Supported |
|---|---|---|
| On-call engineer | Current symptoms, traces, logs, deploy markers, runbook, dependency health | Restore service and reduce customer impact |
| Engineering manager | SLO burn, recurring alerts, incident action items, backlog status | Prioritize reliability work and staffing |
| Product leader | Customer-impacting failures, affected journeys, feature-risk tradeoffs | Balance roadmap speed with user trust |
| Executive team | Trend line, major incidents, remediation progress, risk decisions | Fund the right platform and reliability work |
Where AIOps Fits After The Basics Work
AIOps can help with anomaly detection, event correlation, incident summaries, runbook suggestions, stakeholder updates, and repetitive triage. It should not be the first step for a team that lacks SLOs, clean telemetry, alert ownership, or incident discipline.
Once foundations are stable, AI can accelerate repeated operational work. A good first use case might summarize incident timelines, classify alerts by service ownership, draft status updates, or recommend known runbooks. NextPage supports this through AIOps consulting services, but the implementation should keep human approval, auditability, and rollback controls.
Use the AI Automation ROI Calculator to estimate whether repeated triage or reporting work is large enough to justify a prototype. If the team is still identifying candidate workflows, the Workflow Automation Opportunity Finder can help rank repeatable operations work. The patterns in AI workflow automation apply directly: intake, retrieval, decision support, action, review, and monitoring need explicit controls.
Reliability Maturity Scorecard
A scorecard helps teams choose the next improvement instead of trying to solve every reliability gap at once. Score the current operating model across telemetry coverage, SLO ownership, alert quality, incident response, reliability backlog, and executive reporting.
| Area | Reactive | Measured | Continuously Improving |
|---|---|---|---|
| Telemetry | Signals are incomplete or siloed | Core services are instrumented | Telemetry is correlated around user journeys |
| SLOs | No formal targets | Team-defined SLOs exist | SLOs guide releases and backlog priority |
| Alerts | High noise and false positives | Triage rules and ownership are defined | Alerts are actionable and continuously tuned |
| Incidents | Ad hoc response | Runbooks and reviews are used | Practice, learning, and remediation cadence are consistent |
| Backlog | Only firefighting | Reliability items are tracked | Capacity is reserved for reliability outcomes |
| Reporting | Raw alert counts | Incident and SLO reporting exists | Leadership sees customer impact, budget burn, and remediation progress |
Common Risks And How To Reduce Them
SRE and observability programs fail when teams treat them as dashboards alone, or when reliability becomes a side project without capacity. Reduce risk by making reliability work visible, owned, and tied to product outcomes.
- Tool sprawl: consolidate signal ownership before adding new vendors.
- No SLO discipline: define targets for priority journeys before tuning every low-level metric.
- Alert fatigue: remove noisy alerts and page only on actionable user-impacting symptoms.
- Runbooks that age: test runbooks during game days and after major architecture changes.
- Postmortems without follow-through: turn action items into a funded reliability backlog.
- Weak executive signal: report customer impact, SLO burn, incidents, and remediation progress rather than raw alert counts.
- Modernization without observability: add tracing, ownership, and release markers before splitting systems or changing platforms. This is especially important during monolith to microservices migration services.
How NextPage Helps Teams Improve Reliability
NextPage helps software teams turn reliability goals into practical engineering work: DevOps readiness reviews, cloud foundation planning, CI/CD improvements, observability architecture, dashboard design, incident workflow setup, AIOps opportunities, and production support improvements.
Our custom software development team can also build the internal tools around reliability work: dashboards, workflow queues, integrations, runbook portals, audit trails, reporting automations, and service-owner views. Review the NextPage software and AI portfolio to see how we structure production-ready workflow platforms, dashboards, automation, and internal tools.
Book a reliability and observability assessment with NextPage.