
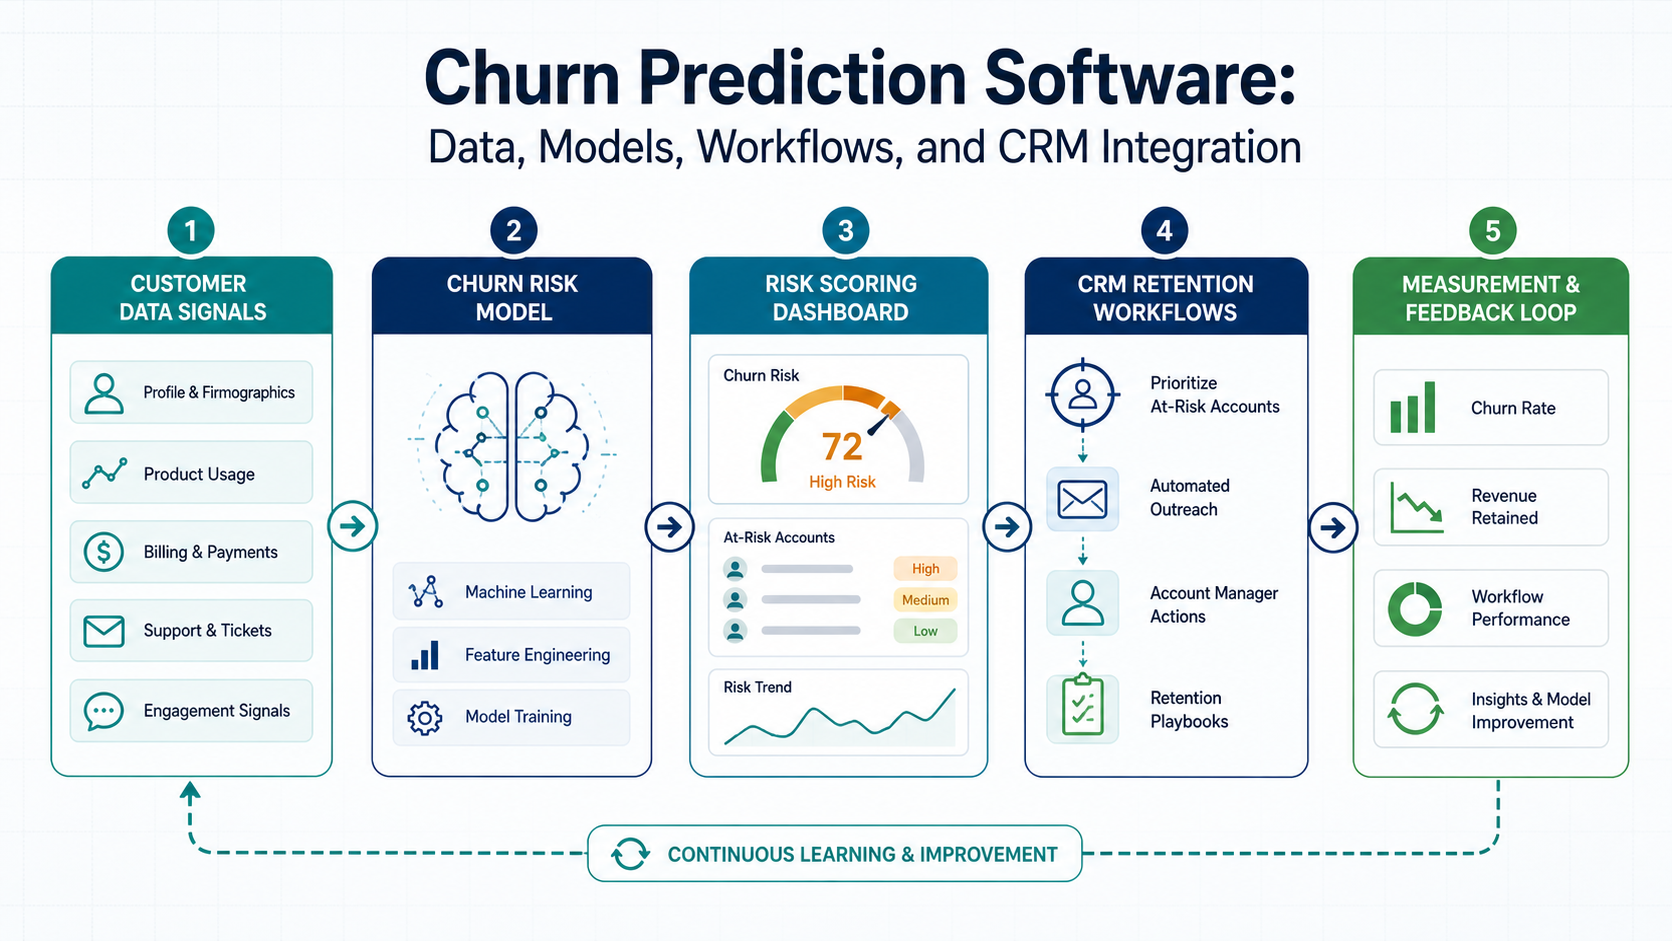
Churn prediction software is useful only when it turns customer risk signals into timely retention action. A model score by itself does not reduce cancellations. The system needs clean customer data, a clear churn definition, a model that can be explained well enough for the team to trust, CRM or product workflows that trigger the right next step, and measurement that proves whether the intervention changed outcomes.
This guide is for SaaS, subscription, marketplace, and CRM-heavy teams planning a first churn prediction MVP. It explains what data to prepare, how to choose model logic, how to connect the score to retention workflows, and how to avoid building an impressive dashboard that no one acts on.
Quick Answer: What Does Churn Prediction Software Need?
Churn prediction software needs a defined churn event, reliable customer and product-usage data, labeled historical examples, model logic, risk thresholds, workflow rules, CRM or product integrations, dashboards, human review, and ongoing monitoring. The strongest MVP usually predicts one churn type for one customer segment, routes high-risk accounts into a specific retention workflow, and measures whether those actions improve renewal, activation, expansion, or repeat purchase behavior.
Start with business impact before model complexity. If a team cannot explain what action should happen when a customer is flagged as high risk, it is too early to invest in a sophisticated model. The AI automation ROI calculator can help compare churn prediction against other automation ideas by estimating the value of a repeated workflow before development begins.
In 2026, the strongest churn prediction programs are judged less by the algorithm alone and more by the action layer around it: segment-specific thresholds, CRM task routing, suppression rules, playbook ownership, and a feedback loop that tells the model which interventions actually helped.
1. Define The Churn Event Before Collecting Features
Churn means different things in different businesses. A B2B SaaS company may define it as subscription cancellation, non-renewal, seat contraction, or failed payment recovery. A marketplace may track seller inactivity, buyer dormancy, or reduced transaction frequency. A consumer app may care about uninstall risk, trial drop-off, or failure to reach an activation milestone.
The model can only learn what the team defines. Pick a churn event, prediction window, and action window. For example: identify accounts likely to cancel in the next 45 days, early enough for customer success to intervene. Or identify trial users unlikely to activate within seven days, early enough for onboarding support to help. The prediction window must leave enough time for a useful response.
| Decision | Example | Why It Matters |
|---|---|---|
| Churn event | Cancellation, non-renewal, inactivity, downgraded plan | Sets the label the model learns from |
| Prediction window | 7, 30, 45, or 90 days before churn | Determines whether there is time to act |
| Action owner | Customer success, sales, product, support, lifecycle marketing | Prevents scores from becoming unused reporting |
| Success metric | Saved revenue, activation lift, renewal rate, repeat purchase | Shows whether interventions changed outcomes |
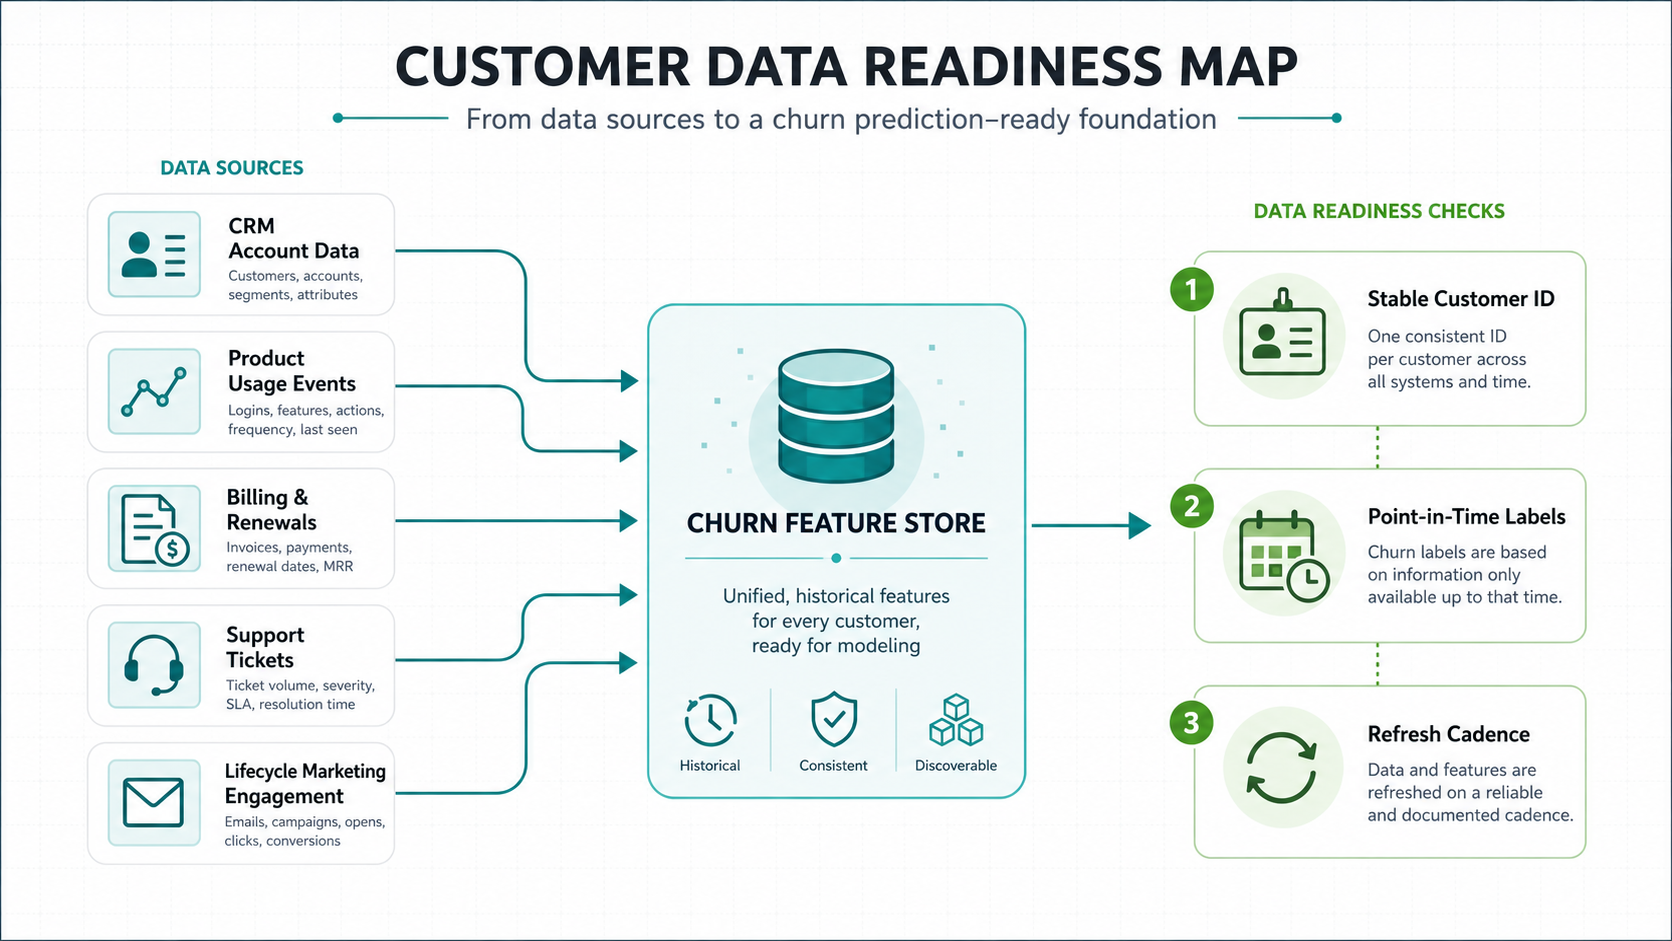
2. Prepare Customer Data That Explains Behavior
Useful churn models depend on signals that describe customer behavior, value, friction, and relationship health. Common inputs include account age, plan type, contract value, usage frequency, feature adoption, support tickets, payment failures, onboarding progress, NPS or CSAT, admin activity, team invitations, email engagement, product milestones, discount history, renewal date, and previous expansion or downgrade events.
Do not assume more data automatically improves prediction. Missing fields, inconsistent account IDs, duplicate CRM records, event-tracking gaps, and delayed warehouse syncs can make a model unreliable. Before training, audit where each field comes from, how often it updates, whether it is available before the prediction date, and who owns its quality.
Churn projects often expose broader integration and reporting work. If the model needs to combine CRM, billing, support, warehouse, and product analytics data, scope that effort like a real software project. The custom software development cost guide is useful for understanding how integrations, reporting depth, user roles, and security affect budget beyond the visible dashboard. The broader custom software development path is also relevant when churn prediction needs a secure retention workspace instead of another reporting tab.
3. Build A Label Strategy That Avoids Leakage
A churn label tells the model which past customers churned and which did not. The label must be generated from data available at the right point in time. If the training data includes signals that only appear after cancellation, such as a closed-loss reason entered by customer success, the model will look accurate in testing but fail in production. This is called leakage.
Good label strategy separates the observation period, prediction date, prediction window, and outcome window. For example, use product activity through March 31 to predict churn between April 1 and May 15. That structure helps the team test whether the model would have known enough before churn happened.
Also decide how to handle ambiguous cases: seasonal customers, paused accounts, one-time buyers, customers who churn and return, unpaid trials, low-value accounts, and enterprise renewals influenced by procurement timing. A simple baseline model with transparent labels is usually better than a complex model trained on unclear outcomes.
Document the exclusions in plain language. If enterprise renewals behave differently from self-serve subscriptions, separate them. If a customer can pause without cancelling, do not treat every pause as churn. If a recovery campaign happened before the prediction date, make sure the model is not learning the result of human intervention as if it were an early signal.
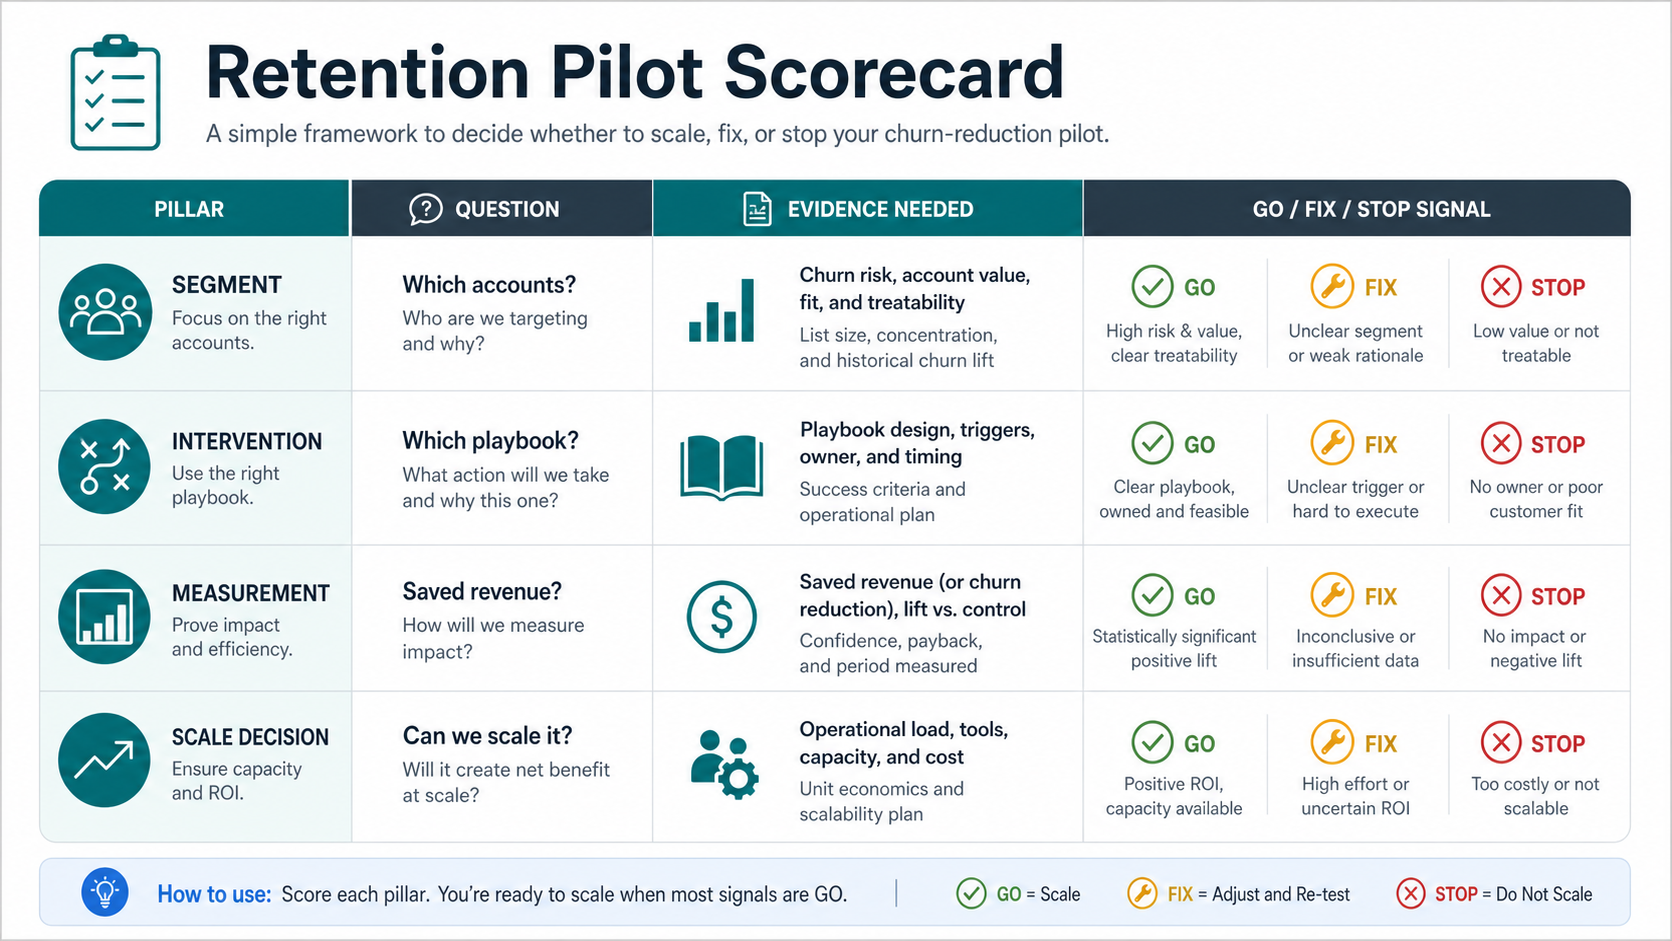
Churn Prediction Readiness Scorecard
Before writing production code, score the idea against four practical readiness checks: data quality, intervention ownership, measurement design, and integration fit. A churn model can be technically accurate and still fail if the team cannot act on the score quickly, if CRM records are too fragmented, or if the pilot cannot separate saved customers from customers who would have renewed anyway.
| Readiness Area | Green Signal | Fix Before Scaling |
|---|---|---|
| Data identity | CRM, product, billing, and support records share a reliable customer or account ID | Duplicate accounts, missing event history, or manual spreadsheet joins |
| Intervention owner | Customer success, lifecycle, product, or support owns a specific playbook | No one is accountable for contacting or helping high-risk customers |
| Measurement | Saved revenue, activation lift, repeat purchase, or renewal impact can be tracked | The team only plans to report model accuracy or dashboard usage |
| Integration fit | Scores can update CRM fields, tasks, dashboards, or product triggers reliably | The workflow depends on manual exports or stale data refreshes |
If two or more areas are red, treat the first release as a data and workflow pilot instead of a full machine learning build. Teams that need help turning the scorecard into a delivery plan can use the AI Agent Readiness Assessment to structure automation prerequisites, owner mapping, and rollout risk before committing engineering effort.
4. Choose The First Model Approach Conservatively
A first churn prediction MVP does not need the most advanced algorithm. Start with an interpretable baseline: rules, logistic regression, calibrated probability scores, gradient-boosted trees, or a simple scoring model based on strong behavioral indicators. More complex machine learning can come later when the team has enough volume, clean historical labels, stable data pipelines, and a measured intervention loop.
For 2026 planning, add a model-governance gate before any score reaches a CRM workflow. Review whether the training window matches the action window, whether protected or sensitive attributes are excluded or justified, whether scores are calibrated enough for threshold decisions, and whether account owners can see the top reasons behind each alert. This keeps churn prediction practical: the team knows when to trust the model, when to override it, and when to send cases to manual review.
Model choice should follow the operating need. Customer success teams may need explanations such as "usage dropped 40 percent," "no admin login in 21 days," or "three unresolved tickets before renewal." Marketing automation may only need a confidence band and segment. Product teams may need feature-level adoption gaps. Finance teams may care about revenue at risk and renewal timing.
For teams adding machine learning to an existing product or CRM stack, the machine learning integration roadmap is a useful companion because churn prediction becomes production software once scores affect real customer workflows. If the model needs custom feature pipelines, explainability, batch scoring, or monitored APIs, NextPage's machine learning development services page maps the production engineering work behind those capabilities.
5. Turn Scores Into Risk Thresholds And Actions
A churn score becomes valuable when it leads to a specific next step. Define risk bands such as low, medium, high, and urgent. Then map each band to an action owner, channel, message, and follow-up rule. Not every at-risk customer should receive a discount. Some need onboarding help, some need technical support, some need executive outreach, and some are bad-fit customers who should not consume high-touch resources.
Use thresholds carefully. A very sensitive threshold may overwhelm the team with false positives. A very strict threshold may miss customers who could have been saved. Pilot the workflow with a manageable segment, review examples manually, and adjust thresholds after observing how account owners respond.
This is where churn prediction becomes AI workflow automation: a trigger, input data, AI-assisted decision, human action, system update, exception path, and feedback record.
The 2026 Operating Model For Churn Prediction
Churn prediction should operate like a retention product, not a one-off analytics model. The operating model needs five owners: a data owner who keeps account identity and event quality stable, a model owner who reviews calibration and drift, a workflow owner who maps score bands to playbooks, a revenue owner who defines saved-value measurement, and a compliance or security owner who checks whether customer data is being used appropriately.
| Operating Layer | Owner | Release Gate |
|---|---|---|
| Data and labels | Data or analytics lead | Point-in-time labels, stable account IDs, documented exclusions |
| Model and thresholds | ML or product analytics owner | Calibration review, false-positive review, threshold rationale |
| Retention playbooks | Customer success, lifecycle, or product owner | Action owner, message, SLA, suppression rules, escalation path |
| Measurement | Revenue, growth, or finance owner | Saved revenue, activation lift, renewal lift, workload impact |
| Risk and governance | Security, privacy, or operations owner | Data-use review, access control, audit trail, rollback plan |
This ownership model also makes partner selection clearer. A vendor or build partner should be able to explain how it will support the data contract, model review, CRM integration, workflow measurement, and post-launch monitoring instead of only showing a dashboard mockup.
6. Integrate With CRM, Product, And Support Workflows
Churn prediction software usually touches the CRM, product analytics, billing, support desk, email platform, customer data warehouse, and internal dashboards. Decide whether scores should be written to account records, surfaced in a customer success workspace, used to create tasks, trigger email journeys, prioritize support queues, or personalize in-app onboarding.
Each integration needs an owner and failure behavior. If the model refresh fails, does the CRM keep yesterday's score or hide the field? If the support desk has stale account IDs, does the workflow stop or create a review queue? If a customer is already in a renewal negotiation, should automated outreach be suppressed?
Write these decisions into acceptance criteria before development starts. A production workflow should include score freshness, owner assignment, duplicate-task prevention, suppression rules, manual override, audit trail, and a way to mark whether the recommended action was completed. Without those details, the model can be technically correct while the retention process stays unmeasured.
For teams whose CRM cannot support the workflow cleanly, the custom CRM development cost guide can help frame whether to extend the current system, build a retention workspace, or create a lightweight internal tool around the existing CRM. When the main blocker is score synchronization, task automation, and customer-success handoff, NextPage's CRM integration and workflow automation services can be the more direct path than rebuilding the whole customer system.
7. Design Dashboards For Decisions, Not Decoration
A churn dashboard should help teams decide what to do this week. Useful views include revenue at risk, top-risk accounts, risk drivers, segment trends, intervention status, saved accounts, unresolved tasks, false-positive examples, and model coverage. Product teams may need cohort views by activation milestone. Customer success may need account-level playbooks. Executives may need risk by segment, plan, region, or renewal month.
Avoid dashboards that only show model confidence. A high score is not an outcome. Pair score visibility with the customer context and the next recommended action. Also show when the system is uncertain or missing key data. Trust improves when teams can see why an account was flagged and when they can correct incorrect assumptions.
The strongest dashboard views are operational: high-risk accounts due this week, accounts with stale signals, completed interventions, saved accounts, false positives, missed churn, revenue at risk by segment, and playbooks that are creating more workload than value. Those views help leaders decide whether to tune the threshold, change the playbook, or narrow the pilot segment.
A 90-Day Churn Prediction MVP Roadmap
A focused MVP can move quickly when the team limits scope. The first version should prove whether the workflow can identify meaningful risk and drive useful retention action, not solve every churn scenario.
| Phase | Focus | Output |
|---|---|---|
| Weeks 1-2 | Churn definition, segment, success metric, data audit | Prediction brief, action owner map, data-gap list |
| Weeks 3-5 | Data pipeline, labels, baseline model, example review | Training set, baseline score, leakage checks, risk-driver review |
| Weeks 6-8 | Workflow integration and dashboard | CRM fields, task rules, playbook triggers, risk dashboard |
| Weeks 9-10 | Pilot with a controlled segment | Reviewed risk list, intervention tracking, false-positive notes |
| Weeks 11-12 | Impact review and production decision | Saved revenue estimate, workflow issues, next-scope plan |
If you are comparing vendors or implementation partners, ask for a baseline model, data-readiness review, evaluation plan, and operating workflow before you ask for algorithm complexity. The machine learning consulting company checklist includes similar questions for production ML planning.
Build Vs Buy Checklist For Churn Prediction Software
Teams usually have three options: configure churn scoring inside an existing customer-success platform, buy a dedicated prediction tool, or build a custom model and workflow around their own data stack. The right choice depends on data ownership, integration depth, explainability, security, and how much retention process change the business can support.
| Decision Area | Buy Or Configure When | Build Custom When |
|---|---|---|
| Data shape | CRM, billing, product, and support data already match the vendor connector model | Customer identity, product telemetry, contracts, or usage events need custom joins |
| Workflow fit | Standard health scores, alerts, and playbooks are enough for the team | Scores must trigger custom CRM tasks, in-app prompts, account routing, or approval logic |
| Explainability | Teams only need broad risk reasons and segment views | Account owners need driver-level explanations, audit trails, or regulated review |
| Measurement | The goal is faster customer-success prioritization | The goal is measured saved revenue, activation lift, or experiment-backed retention impact |
| Governance | Vendor controls and data policies satisfy security review | Data residency, access control, model monitoring, or internal policy requires ownership |
A practical path is to start with the simplest tool that can prove intervention value. If the first pilot shows real lift but the workflow is constrained by vendor limits, then custom scoring, data pipelines, and automation become easier to justify.
8. Monitor Model Quality And Retention Impact After Launch
Customer behavior changes. Pricing changes, onboarding changes, feature releases, support quality, seasonality, economic pressure, and competitor moves can all shift churn patterns. Monitor prediction coverage, data freshness, score distribution, precision, recall, false positives, missed churn, intervention completion, saved revenue, customer complaints, and account-owner feedback.
Also monitor the workflow, not only the model. If high-risk tasks are created but ignored, the model may be fine while the retention process fails. If interventions save customers but require too much manual effort, the workflow may need better automation or a narrower segment. The MLOps implementation checklist is useful once churn prediction moves from MVP to a maintained production system.
Review model behavior on a recurring cadence. Look for drift in score distribution, degraded precision in important segments, new product features that changed customer behavior, missing usage events, CRM field changes, and playbooks that no longer match the reason an account was flagged. Churn prediction is a living system because both the product and customer base keep changing.
Common Mistakes To Avoid
- Predicting churn without an action plan. Scores must map to owners, messages, tasks, and follow-up rules.
- Training on leaked data. Exclude fields that only exist after churn or after a human already knew the customer was leaving.
- Using one threshold for every segment. Enterprise renewals, self-serve subscriptions, trials, and seasonal accounts often need different review rules.
- Ignoring low-data segments. New customers, seasonal users, and enterprise accounts may need separate logic or manual review.
- Over-automating retention outreach. Some accounts need a human conversation, not a generic discount email.
- Measuring only model accuracy. Track saved revenue, activation lift, renewal rate, retention workload, and customer experience.
How NextPage Helps Build Churn Prediction Software
NextPage can help turn churn prediction from an analytics idea into a buildable software workflow: data audit, label strategy, baseline modeling, dashboard design, CRM integration, retention playbooks, pilot measurement, and production monitoring.
If your team is planning churn prediction for a SaaS product, subscription platform, marketplace, or CRM-heavy business, start with a focused pilot. Define the churn event, pick one segment, connect the score to a real retention workflow, and measure whether the actions change outcomes. From there, NextPage's AI development services can help expand the system into deeper customer analytics, automated playbooks, and production-grade model operations. If you are comparing partners, the custom software development company checklist gives procurement teams a practical way to evaluate discovery, delivery, security, and post-launch ownership.