
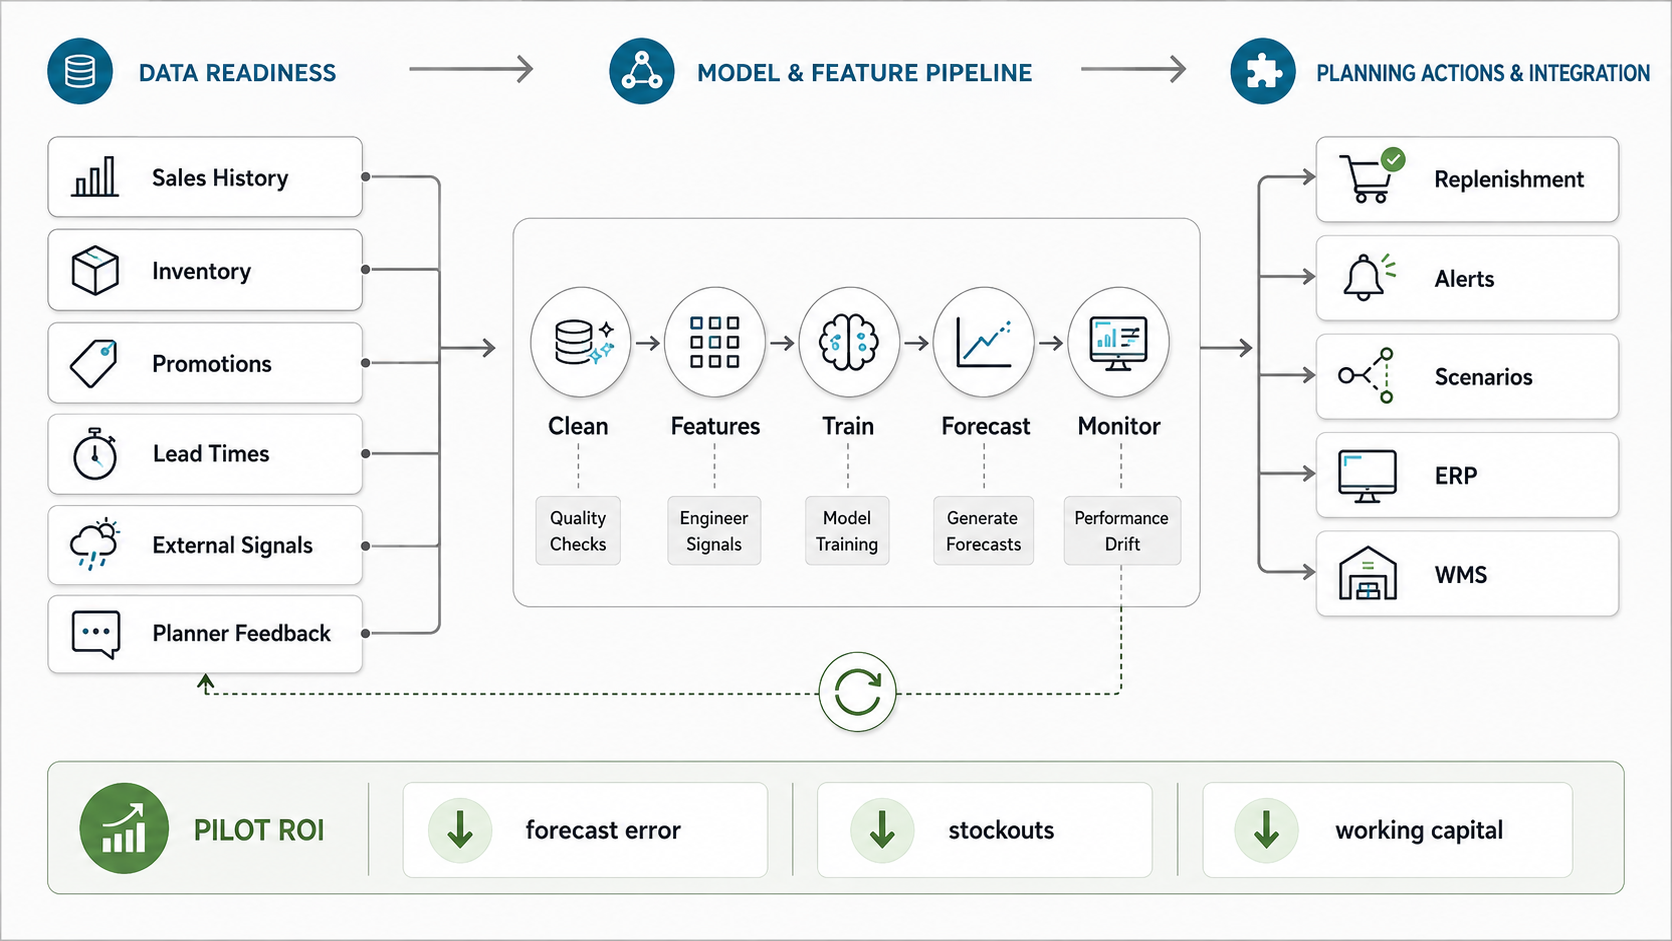
AI demand forecasting implementation works when the team treats forecasting as an operating workflow, not just a model project. The model is only one part of the system. Reliable forecasts depend on clean demand history, product hierarchy, inventory and lead-time data, promotion context, external signals, planner feedback, ERP or WMS integration, and a pilot that proves measurable business value before the rollout expands.
The best first project is usually not a company-wide forecasting transformation. It is a controlled pilot around a high-impact product family, region, warehouse, or channel where forecast error, stockouts, overstocks, expedites, and planner effort can be measured. Start with a baseline, improve the decision loop, and then scale the pattern.
If you are unsure whether the organization has enough workflow clarity and data access for a first AI project, start with NextPage's AI Agent Readiness Assessment. Even though it is framed around agents, the same checks matter for forecasting: clear workflow, usable data, integration access, human review, and governance.
Quick Answer: AI Demand Forecasting Implementation
AI demand forecasting implementation should start with data readiness and a narrow pilot. The team should define the planning decision, build a baseline forecast, prepare historical and external signals, choose models that match the demand pattern, integrate outputs into planning workflows, and measure ROI through forecast error, service level, stockouts, overstock, planner time, and working capital.
| Implementation Layer | What To Define | Proof Before Scaling |
|---|---|---|
| Business decision | SKU replenishment, inventory allocation, production planning, staffing, procurement, or promotion planning. | The forecast changes a real planning action, not just a dashboard number. |
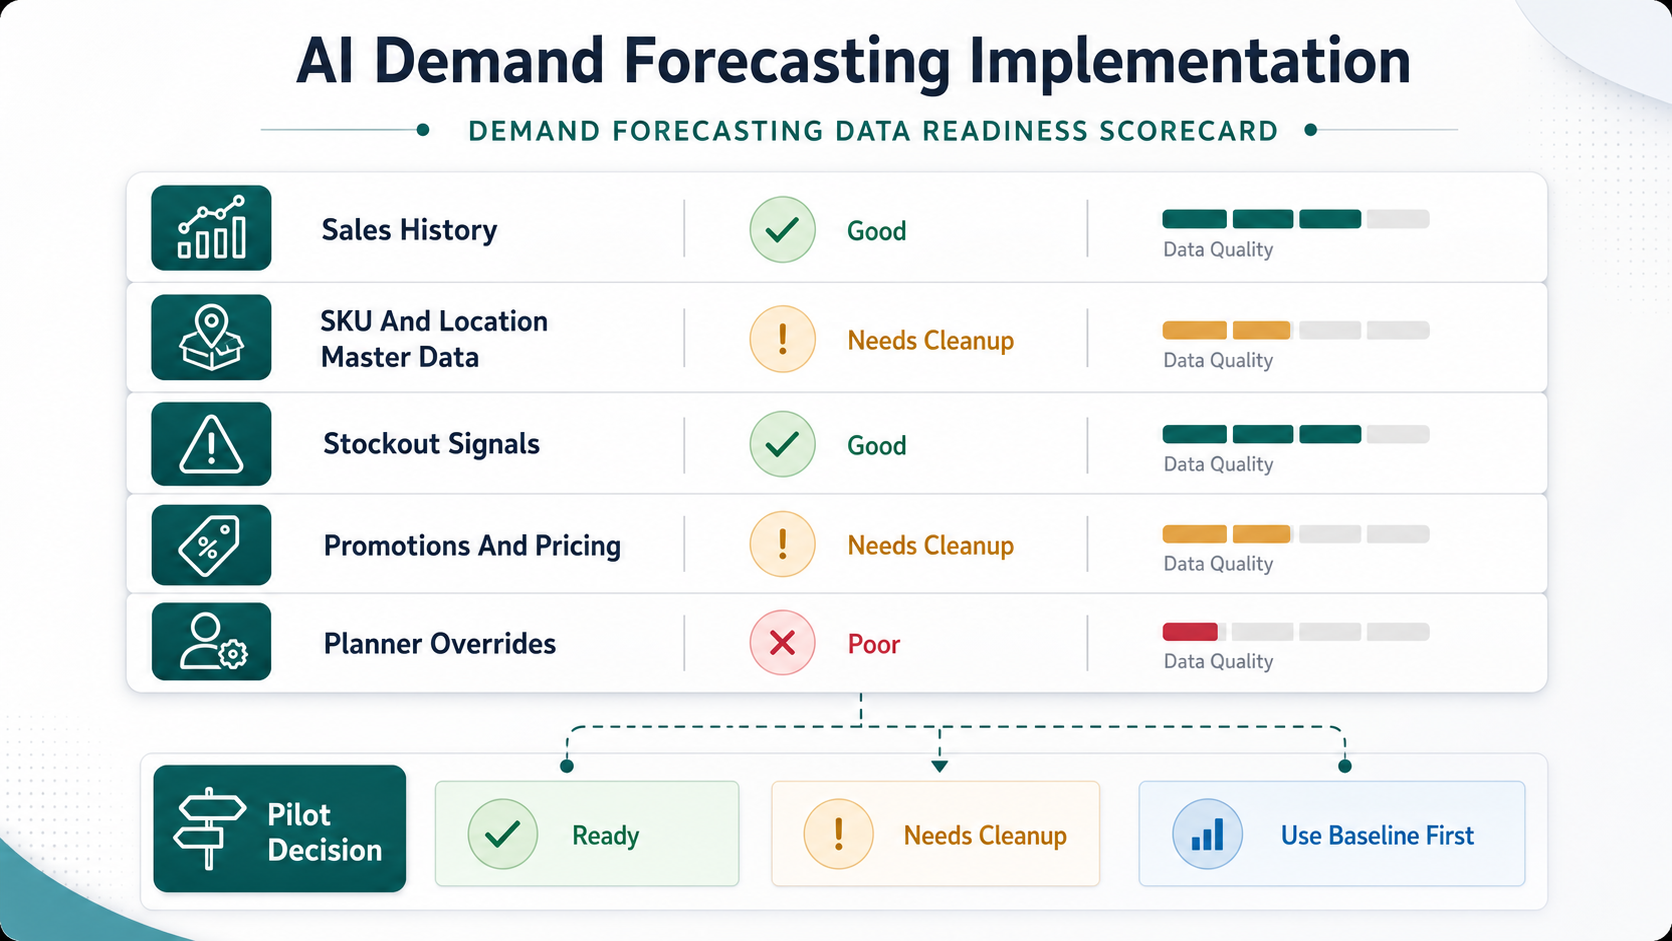
| Data readiness | Demand history, stockouts, returns, promotions, prices, lead times, events, hierarchy, and data owners. | Inputs are accessible, fresh, documented, and explainable enough for planners to trust. |
| Model strategy | Baseline, statistical models, machine learning, deep learning, ensembles, and scenario simulation. | The model beats a simple baseline on business-relevant segments. |
| Integration | ERP, WMS, planning tools, BI dashboards, alerts, APIs, and approval workflows. | Forecasts reach the people and systems that make inventory or production decisions. |
| ROI loop | Forecast error, bias, service level, stockout rate, overstock, waste, working capital, and planner effort. | The pilot has a before/after measurement model and a rollout decision gate. |
Start With Data Readiness, Not Model Selection
Forecasting models learn from operational history. If the data does not show true demand, the model will learn distorted demand. Sales history can understate demand when stockouts occurred. Promotions can look like demand spikes unless the model knows they happened. New product launches, substitutions, returns, supplier delays, channel shifts, price changes, weather, holidays, and one-off events all change what the data means. For supply-chain teams, this mirrors the decision-loop guidance in NextPage's AI in supply chain management guide: better predictions matter only when they improve a real operating decision.
A demand forecasting data audit should answer five questions. Which system owns each signal? How far back does usable history go? Which fields are missing or inconsistent? Which events explain abnormal demand? Which planning decisions will use the forecast? NextPage's AI data readiness checklist is a useful companion because it focuses on accessibility, ownership, quality, freshness, privacy, and workflow fit.
| Data Signal | Why It Matters | Readiness Check |
|---|---|---|
| Historical demand | Core pattern for trend, seasonality, and volatility. | Separate shipped sales from true unconstrained demand when stockouts occurred. |
| Inventory and stockouts | Explains lost sales, service-level risk, and reorder constraints. | Track on-hand, reserved, inbound, backorder, and availability by location. |
| Promotions and price | Prevents the model from treating campaigns as normal demand. | Capture campaign dates, discount depth, channel, and featured product groups. |
| Lead times and supplier reliability | Connects forecast outputs to replenishment decisions. | Use actual lead-time variance, not only standard vendor lead time. |
| External signals | Improves context for weather, holidays, local events, macro trends, or marketplace activity. | Use only signals that are available reliably at prediction time. |
Build A Baseline Before Calling It AI
A baseline forecast is the control group. It can be as simple as seasonal naive, moving average, exponential smoothing, or the current planner forecast. Without a baseline, teams cannot tell whether a machine learning model is creating value or just producing a more sophisticated number.
The baseline should be evaluated by segment, not only averaged across all SKUs. Fast movers, intermittent items, seasonal products, promoted products, long-tail items, new products, and supply-constrained SKUs behave differently. A model that improves total error but worsens high-margin or high-risk items may not be a business win.
For many teams, the first improvement comes from feature engineering and data correction before advanced modeling. Better product hierarchy, promotion flags, lost-sales adjustment, and lead-time features can make a simpler model more useful than a complex model trained on weak inputs.
Choose Models Around Demand Patterns
AI demand forecasting is not one model. The right approach depends on demand volume, seasonality, forecast horizon, product lifecycle, data quality, planning cadence, and explainability needs. Statistical models can work well for stable seasonal demand. Gradient-boosted models can capture nonlinear effects from price, promotions, channel, and inventory. Deep learning may help with large, multi-series data, but it needs enough history and careful monitoring.
Use ensembles when no single method wins across all segments. Use hierarchical forecasting when product, category, region, and channel forecasts must reconcile. Use probabilistic forecasts when planners need ranges and service-level decisions rather than one number. Use scenario simulation when leaders need to compare promotions, supply constraints, price changes, or demand shocks.
NextPage's machine learning development services page reflects the production view: use-case discovery, data readiness, model design, data pipelines, training, evaluation, APIs, monitoring, and iteration all have to be designed together.
Integrate Forecasts Into ERP, WMS, And Planning Workflows
A forecast that sits in a notebook or static dashboard rarely changes operations. Demand forecasts need to connect to replenishment, inventory allocation, procurement, production scheduling, labor planning, or finance planning. That usually means integration with ERP, WMS, MRP, planning spreadsheets, BI tools, supplier portals, or custom workflow software. Retail and marketplace teams can also compare this against NextPage's AI for retail and eCommerce service path when demand forecasting is tied to merchandising, pricing, support, and inventory workflows.
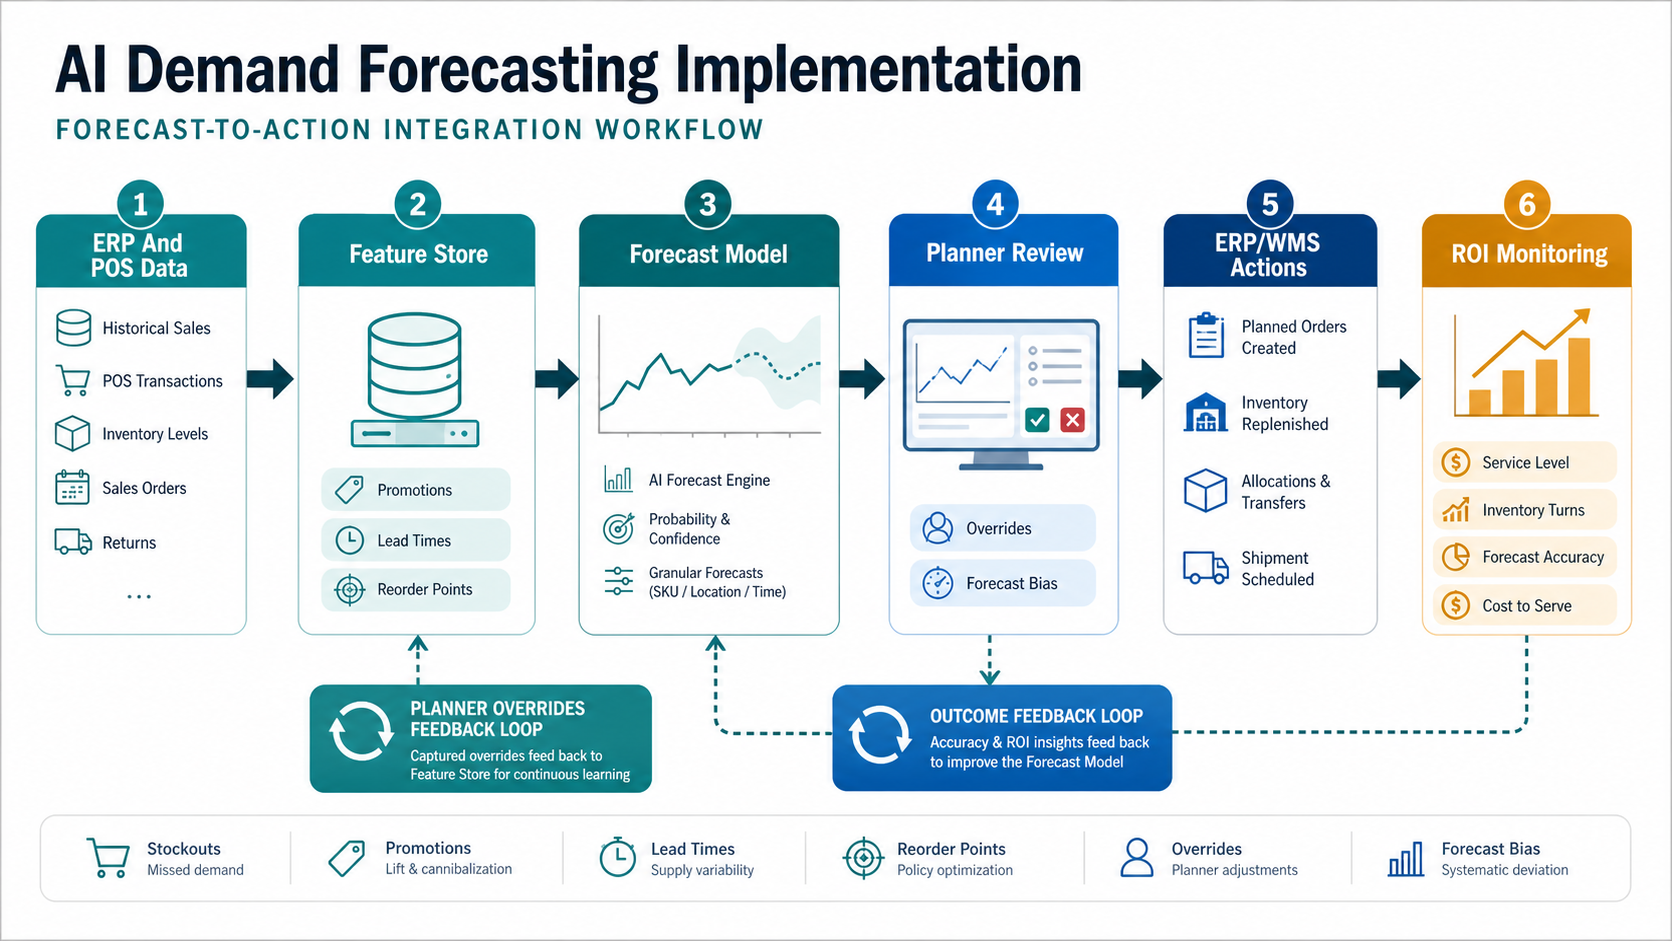
Integration design should define the forecast granularity, cadence, write-back behavior, planner approval rules, exception alerts, and audit trail. Some teams need daily SKU-location forecasts. Others need weekly category forecasts with confidence intervals. Some planning actions can be automated; others need human approval because supply constraints, customer commitments, or margin tradeoffs are involved.
NextPage's predictive analytics services page is relevant here because forecasting is valuable only when it becomes decision support: pipelines, models, dashboards, alerts, and business actions tied to measurable outcomes.
A Practical Pilot Roadmap
Phase 1: define the planning decision. Choose the specific decision the forecast should improve. Examples include replenishment for a product family, demand sensing for promotions, production planning for a factory cell, inventory allocation across warehouses, or supplier ordering for long-lead items.
Phase 2: prepare and audit data. Inventory source systems, clean demand history, adjust for stockouts, add product hierarchy, label promotions, calculate lead-time variance, and document known anomalies.
Phase 3: build baseline and candidate models. Compare the current process with simple baselines and one or more machine learning models. Evaluate by segment, not just overall error.
Phase 4: integrate planner workflow. Put forecasts into the planning tool, dashboard, API, or approval workflow where decisions happen. Add explanations, confidence ranges, exception flags, and manual override capture.
Phase 5: measure ROI and scale. Compare before/after forecast error, bias, stockouts, overstock, waste, expedite cost, service level, working capital, and planner time. Scale only after the pilot shows value and the operating model is clear.
For retail and eCommerce contexts, NextPage's demand forecasting software for retail and eCommerce article goes deeper into SKU planning, inventory, pricing, promotions, and channel-specific use cases.
Pilot ROI Metrics That Matter
Forecast accuracy is not enough. The business case should connect model quality to decisions and financial outcomes. A forecast can be more accurate but still fail if it arrives too late, lacks planner trust, ignores supply constraints, or cannot trigger the right replenishment action. For a directional business case before a larger build, the AI Automation ROI Calculator helps translate planner time, exception volume, review effort, and automation potential into a first ROI estimate.
| Metric | Why It Matters | How To Use It |
|---|---|---|
| Forecast error and bias | Shows whether forecasts are closer to actual demand and whether they systematically over- or under-forecast. | Track by SKU segment, channel, location, and horizon. |
| Stockout rate | Measures service-level risk and lost revenue. | Compare pilot items with a control group when possible. |
| Overstock and waste | Captures working capital, markdown, spoilage, and storage impact. | Track inventory value and aging, not only unit count. |
| Planner effort | Shows whether the system reduces manual spreadsheet work. | Measure hours spent on forecast prep, exception review, and reconciliation. |
| Decision adoption | Reveals whether teams trust and use the forecast. | Track accepted recommendations, overrides, and override reasons. |
When the use case is broader supply-chain automation, NextPage's AI solutions for logistics and supply chain operations page maps demand forecasting to replenishment, routing, dispatch, warehouse, and exception workflows. The FreightLens logistics audit case study and RouteForge logistics workflow case study show adjacent operations-software patterns where data quality, workflow ownership, and measurable exceptions matter as much as the model layer.
Governance, Explainability, And Monitoring
Demand forecasting affects inventory, service levels, purchasing, production, and cash. That makes governance part of the implementation, not a later compliance layer. Define who owns data quality, who approves forecast changes, who can override recommendations, and how exceptions are reviewed.
Explainability should be practical. Planners do not need every model coefficient. They need to know what changed, which inputs drove the forecast, whether confidence is high or low, and what the recommended action is. Monitoring should track data drift, model performance, forecast bias, missing feeds, late jobs, and planner overrides.
For production AI programs, NextPage's AI development services page explains how model APIs, monitoring, workflow automation, and human review fit into enterprise AI delivery.
Build Vs Buy For AI Demand Forecasting
Buying a forecasting platform can work when the company has standard planning workflows, clean connectors to common ERP or commerce systems, and a team that wants faster configuration over custom model ownership. This is often the right starting point for teams that need better dashboards, replenishment suggestions, and scenario planning without building a data science product from scratch.
Custom development becomes more attractive when the forecasting problem is tied to proprietary demand signals, unusual product hierarchies, complex supply constraints, multi-echelon inventory, custom pricing or promotions, regulated data, or planning workflows that off-the-shelf tools cannot model cleanly. A manufacturer with production constraints, a retailer with marketplace and store demand, or a distributor with supplier reliability issues may need a model and workflow layer tuned to its operating reality.
The middle path is often best. Use existing data platforms, BI tools, workflow systems, and planning software where they fit, then build the forecasting, feature pipeline, model API, or decision layer that creates competitive advantage. The implementation plan should make this explicit so the team does not accidentally overbuild commodity features or underbuild the custom logic that actually changes planning outcomes.
Common Implementation Pitfalls
The most common mistake is starting with model selection before defining the planning decision. A model can predict demand at a daily SKU-location level, but if the business makes purchasing decisions weekly at category level, the output will create friction. The second mistake is ignoring stockouts and substitutions, which makes historical sales look like true demand when customers may simply have been unable to buy.
Another failure pattern is building a dashboard without operational ownership. Someone needs to review exceptions, approve overrides, handle bad data, and decide when a model should be retrained or paused. AI demand forecasting is not a one-time report; it is a living planning process. Teams that assign owners, document assumptions, and review outcomes regularly get more value than teams that treat the model as an automated oracle.
How NextPage Can Help
NextPage helps teams move from AI interest to a practical forecasting pilot. That can include data readiness assessment, source-system audit, feature engineering, model design, integration architecture, dashboard and workflow design, MLOps, monitoring, and ROI measurement.
The right first question is not which model to use. It is which planning decision will become faster, more accurate, or less reactive when the forecast improves. Once that decision is clear, the data, integration, model, and rollout plan become much easier to scope.