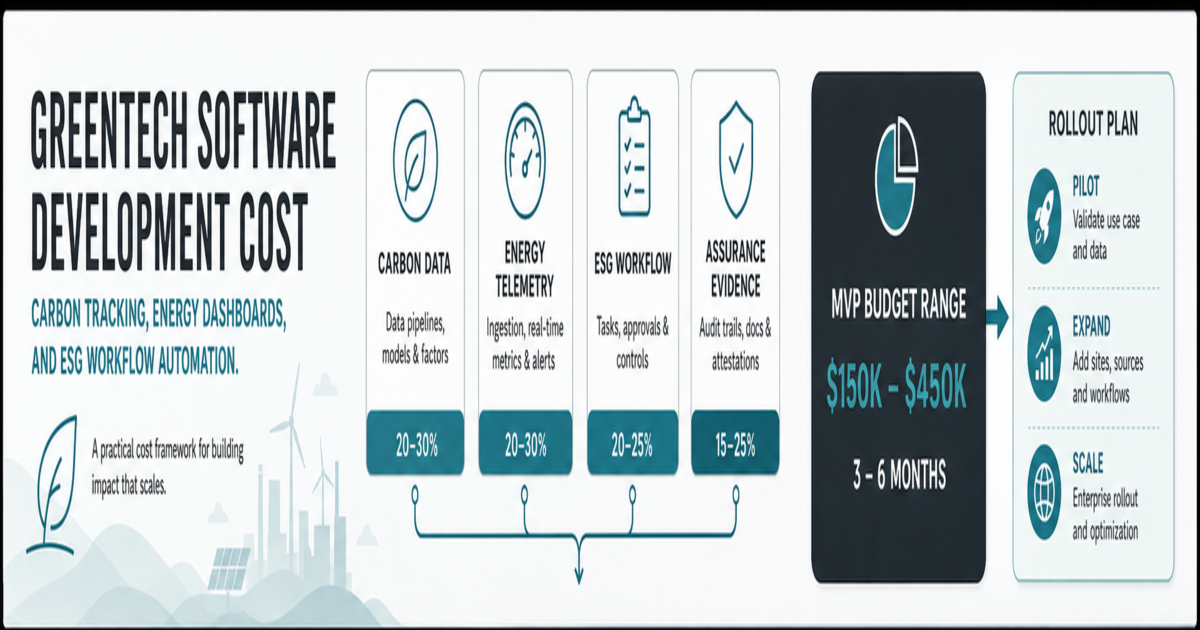

Greentech software development cost usually starts around $40,000-$80,000 for a focused MVP and can move beyond $250,000 when the platform needs carbon accounting, energy dashboards, IoT telemetry, ESG workflow automation, audit evidence, and enterprise integrations. The useful planning question is not "how much does a green app cost?" It is which data, calculations, workflows, and reporting responsibilities the software must own.
A simple sustainability dashboard can sit on top of spreadsheets and imported utility data. A production greentech platform is different. It may collect Scope 1, Scope 2, and Scope 3 data, normalize energy and emissions factors, validate supplier evidence, alert operators about anomalies, support reduction initiatives, and prepare audit-ready ESG reports. Each layer adds cost because it changes the data model, integration depth, QA burden, and governance requirements.
If you need a first-pass range before vendor calls, start with NextPage's Custom Software Cost Estimator. Then use the roadmap below to decide whether your first release should be a carbon-tracking MVP, an energy operations dashboard, an ESG workflow system, or a broader sustainability platform.
Quick Answer: Greentech Software Development Cost
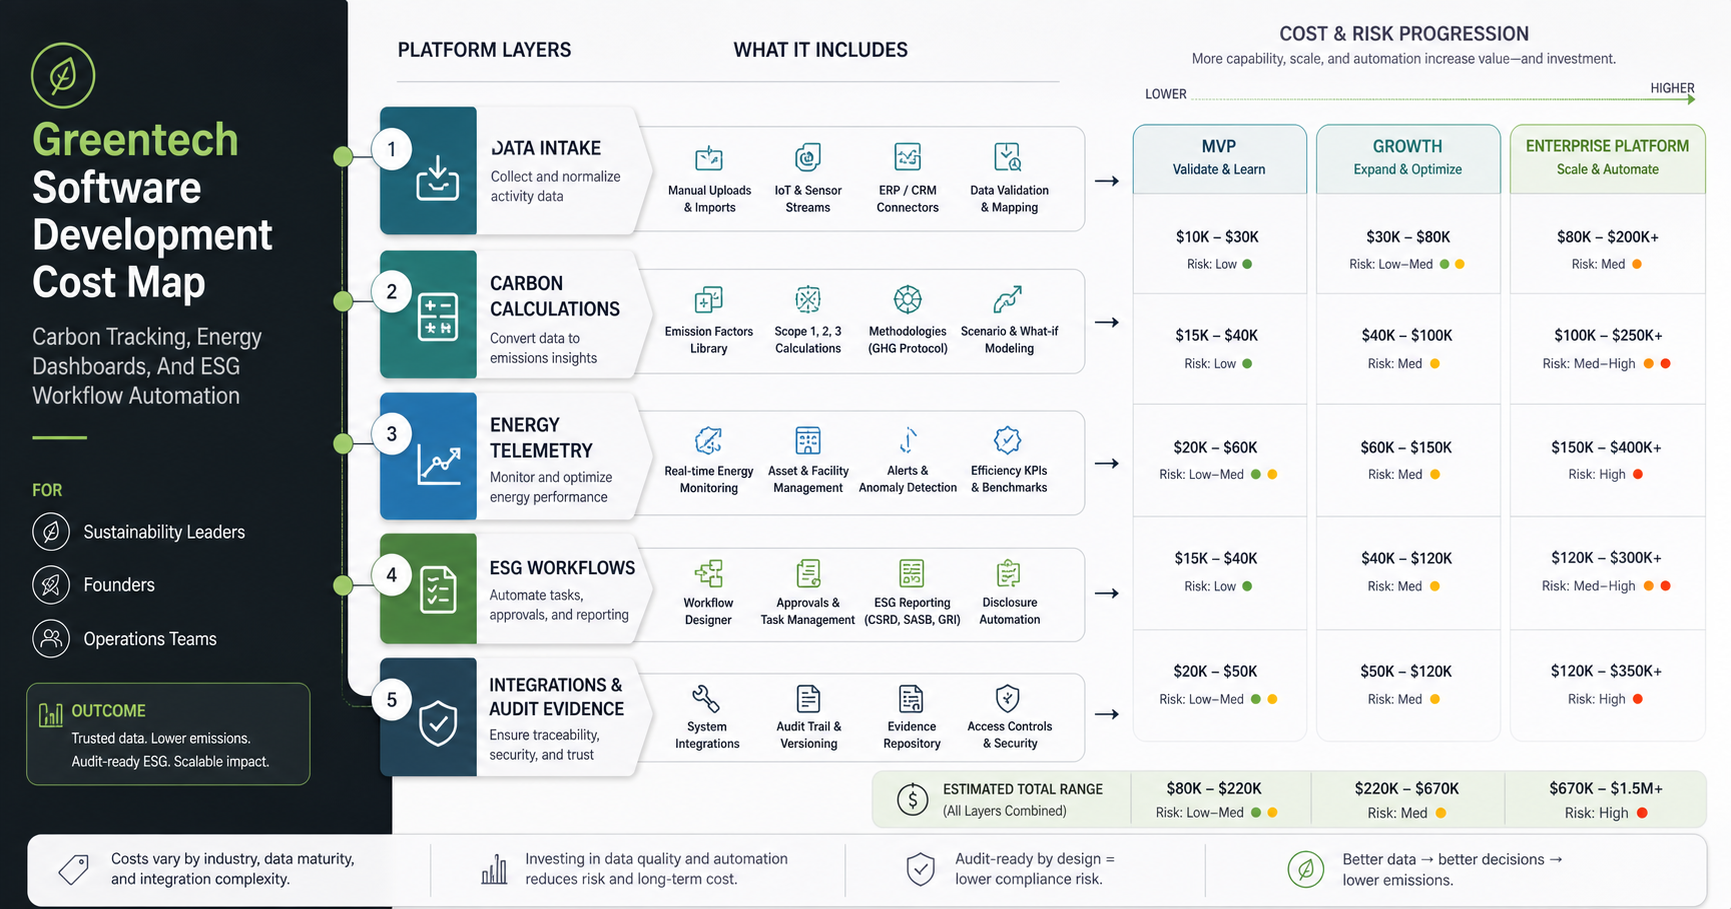
Greentech software development cost depends on the platform's operating model. A lightweight MVP for one workflow can be built with a smaller team. A multi-site sustainability platform with IoT feeds, carbon accounting methodology, supplier data, ESG approvals, role-based dashboards, and external system integrations needs a larger implementation plan.
| Scope | Typical Build Range | Best Fit | Primary Risk |
|---|---|---|---|
| Carbon tracking MVP | $40,000-$80,000 | One organization, limited data sources, basic emissions calculations, dashboard, CSV imports, and manual review. | Methodology gaps and spreadsheet-quality source data. |
| Energy dashboard and alerts | $70,000-$150,000 | Utility data, meters, IoT feeds, site dashboards, threshold alerts, and monthly savings reports. | Device reliability, data latency, and noisy telemetry. |
| ESG workflow platform | $90,000-$200,000 | Evidence collection, approvals, audit trails, supplier requests, document storage, and reporting workflows. | Governance complexity and unclear ownership across departments. |
| Enterprise sustainability platform | $200,000-$500,000+ | Multi-region data, Scope 1/2/3, ERP and procurement integrations, forecasting, APIs, and audit-ready reporting. | Integration scope, compliance interpretation, data quality, and long-term support. |
These are planning bands, not fixed quotes. Custom software cost follows workflow risk, integration depth, data quality, security needs, and support responsibility more than screen count. That broader pattern is explained in NextPage's custom software development cost guide.
Define What Kind Of Greentech Platform You Are Building
"Greentech software" can mean several different products. A carbon accounting tool measures emissions. An energy management system tracks utility or asset performance. An ESG workflow product manages evidence, approvals, and disclosure readiness. A sustainability analytics platform may combine all of these with scenario modeling, supplier collaboration, and executive reporting.
Confusing these categories causes budget problems. A founder may ask for a dashboard, but the real requirement is a governed calculation engine. A sustainability team may ask for ESG reporting, but the expensive part is supplier evidence collection. A facilities team may ask for real-time energy alerts, but the project depends on meter access, IoT data quality, and operational escalation rules.
The first planning step is to choose the platform's center of gravity. The companion GreenTech software development roadmap is useful when the team still needs to connect sustainability data, cloud efficiency, product scope, and rollout sequencing before estimating the build.
- Carbon accounting: collect activity data, map emissions factors, calculate CO2e, track baselines, and support Scope 1, Scope 2, and Scope 3 reporting.
- Energy operations: ingest meter, building, production, fleet, or device data and convert it into dashboards, alerts, forecasts, and optimization actions.
- ESG workflow automation: collect evidence, assign owners, approve submissions, maintain audit trails, and prepare structured disclosures.
- Sustainability product platform: combine customer-facing portals, data APIs, analytics, and reduction planning into a commercial SaaS product.
The Real Cost Drivers
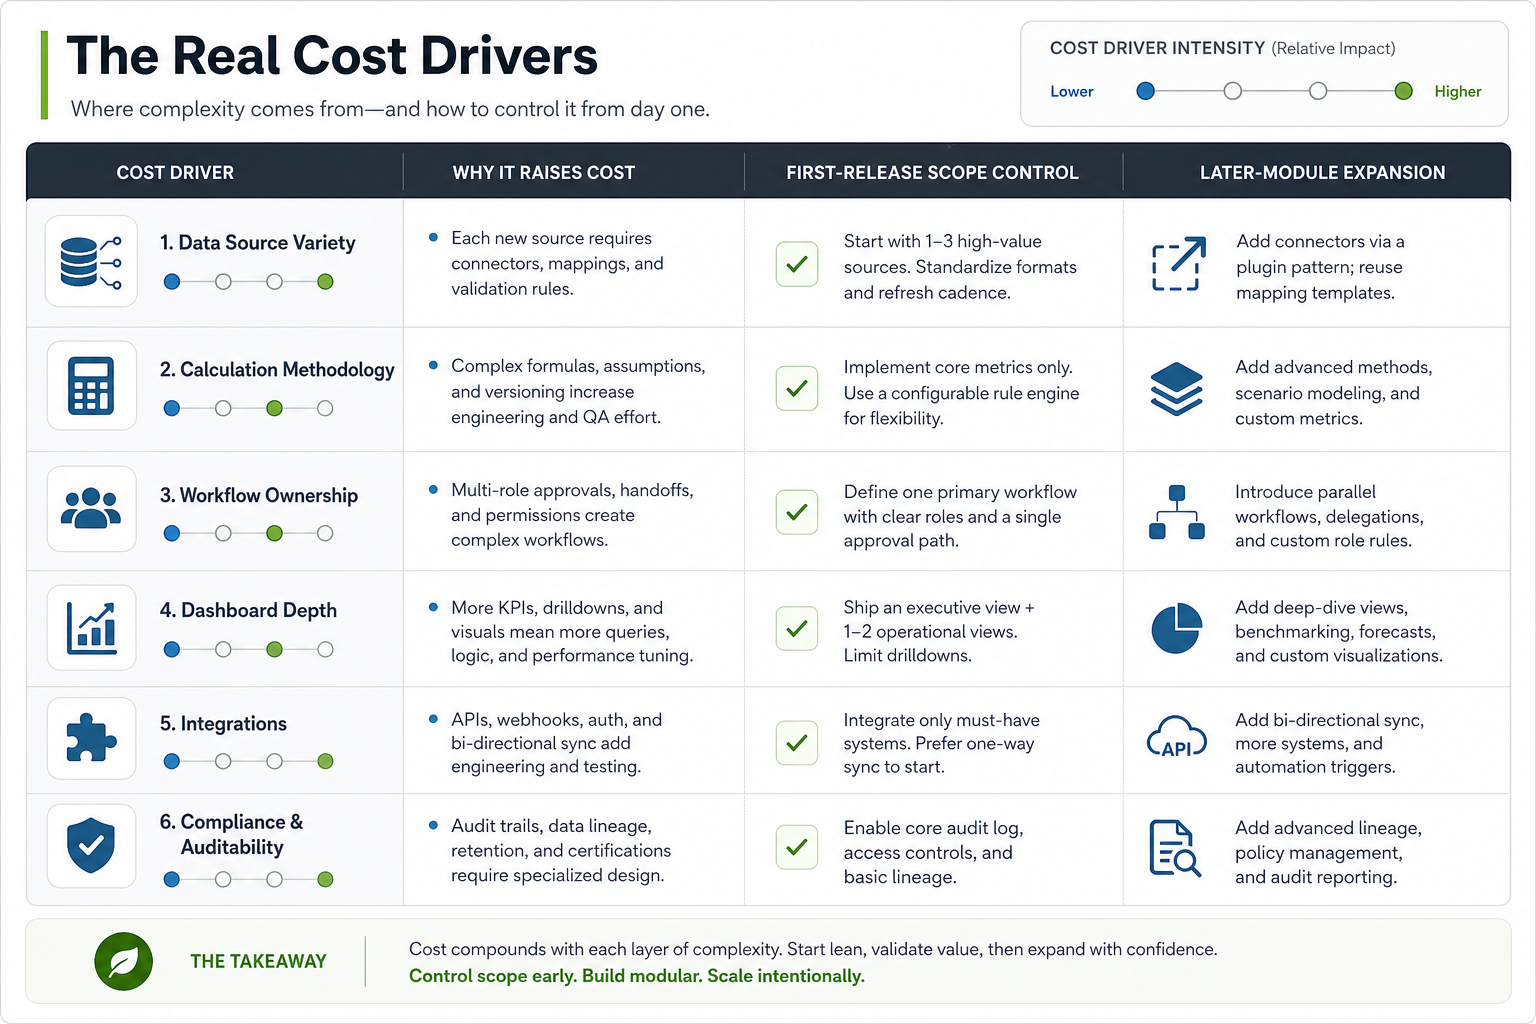
Greentech platforms become expensive when the software must be trusted by finance, operations, auditors, investors, regulators, or enterprise customers. That trust depends on data lineage, calculation transparency, review workflows, and integration reliability.
| Cost Driver | Why It Matters | How To Control Scope |
|---|---|---|
| Data source variety | Utility bills, meter feeds, IoT sensors, ERP records, procurement exports, fleet data, and supplier forms all arrive in different formats. | Start with the highest-value data sources and defer low-volume edge cases. |
| Calculation methodology | Carbon accounting and sustainability metrics require documented assumptions, factors, units, boundaries, and versioning. | Define the first reporting boundary before building a universal rules engine. |
| Workflow ownership | ESG data often crosses finance, operations, procurement, facilities, legal, and leadership teams. | Launch with a small number of roles, clear approvals, and a visible audit trail. |
| Dashboard depth | Executives need trends; operators need alerts; analysts need exportable details; auditors need evidence. | Design dashboards by decision, not by every metric that could be charted. |
| Integrations | ERP, procurement, HR, utility APIs, IoT platforms, data warehouses, and reporting systems add authentication, mapping, retries, and monitoring. | Build integration adapters in phases and include exception queues from day one. |
| Compliance and auditability | Reported data must be explainable, reproducible, permissioned, and traceable. | Keep assumptions, source files, user actions, and calculation versions visible. |
Total Cost Of Ownership: Build, Buy, Or Hybrid?
Subscription pricing for carbon accounting and ESG tools is only part of the decision. The real three-year cost includes implementation support, data cleanup, supplier outreach, integrations, verification support, admin time, training, and the cost of changing methodology when standards or reporting boundaries evolve.
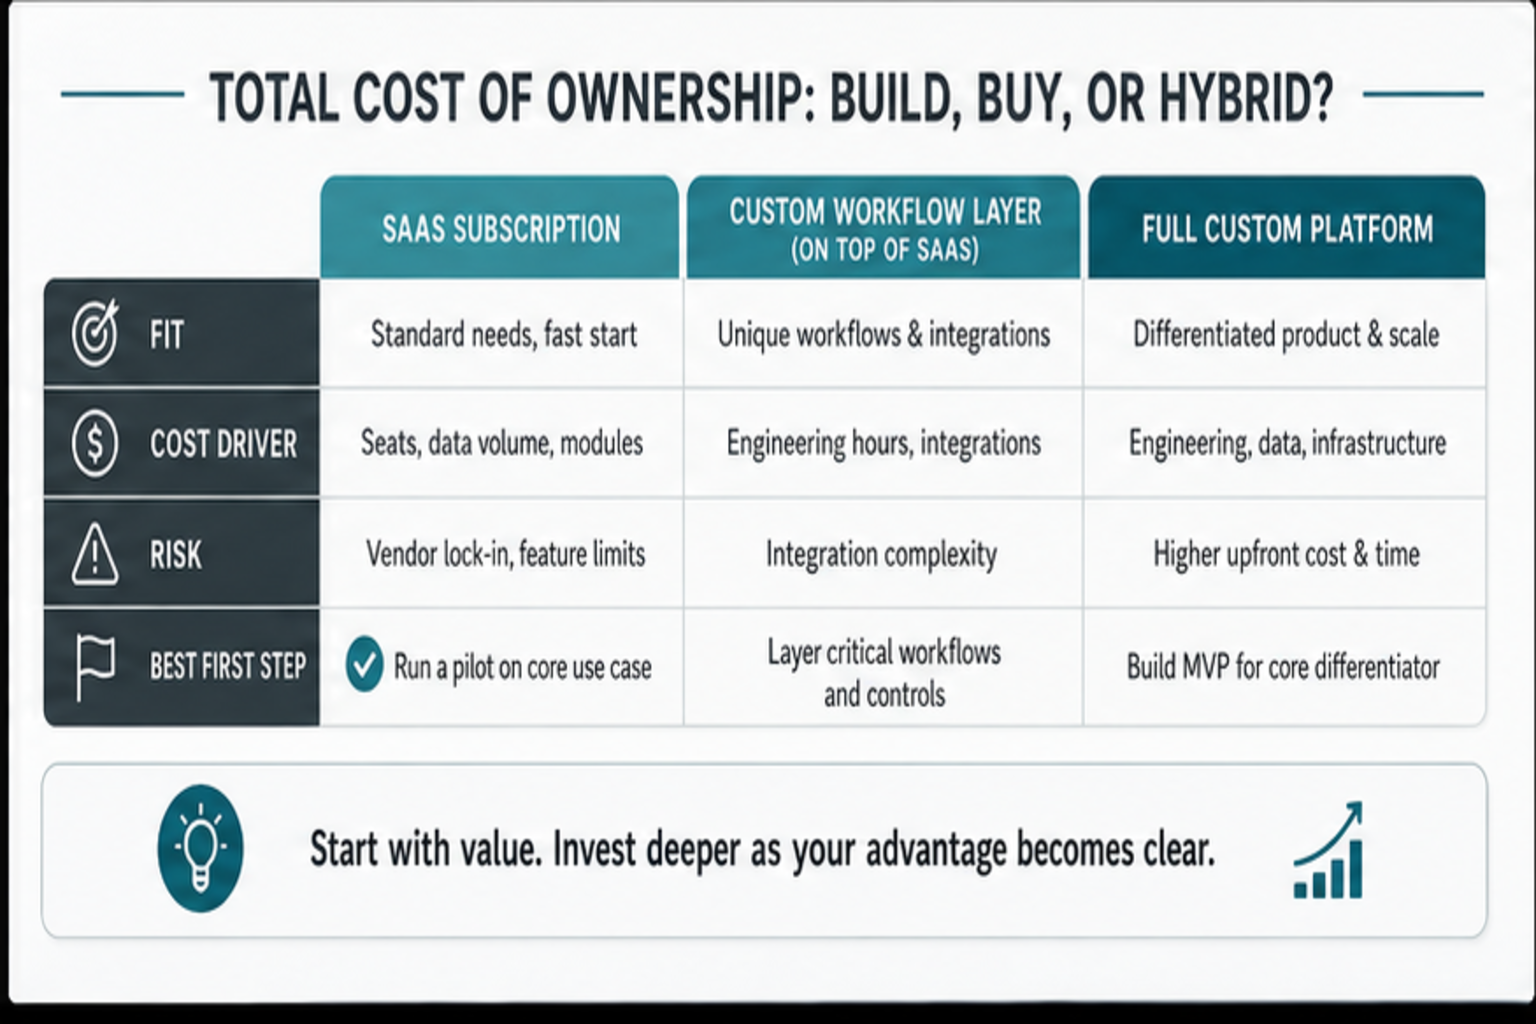
Buy an existing platform when your needs match a standard carbon accounting, ESG reporting, or energy management workflow. Many teams are better served by proven software when they need common reporting templates, standard emission factors, or a mature supplier ecosystem.
Build custom software when the product or operating model is differentiated. Custom development makes sense when you need unusual data sources, proprietary scoring, industry-specific dashboards, customer-facing sustainability portals, deep ERP or IoT integrations, regional workflow rules, or a commercial SaaS product around your own methodology. A hybrid approach is often best: use existing platforms or data services for commodity reporting needs, then build the custom data ingestion, workflow, customer portal, or analytics layer that creates differentiation.
Benchmark Subscriptions Before A Custom Build
Before approving custom development, compare the build against the subscription and implementation path buyers now see in 2026 ESG and carbon accounting tools. The right comparison is not license fee versus engineering fee. It is the total operating model: data ownership, supplier collection, assurance support, reporting frameworks, finance integration, and the cost of adapting the system when methodology or disclosure boundaries change.
| Decision Area | Use A Platform When | Build Or Extend When |
|---|---|---|
| Carbon accounting | You need standard Scope 1, 2, and 3 calculations, common emission-factor libraries, and familiar report templates. | You need proprietary calculations, regional methods, product-level footprints, or customer-facing carbon features. |
| ESG reporting | The main job is disclosure workflow, evidence collection, and repeatable reporting across known frameworks. | The workflow must connect deeply to finance, procurement, facilities, operations, or a differentiated sustainability product. |
| Energy operations | You need utility bill tracking, portfolio dashboards, and alerts that existing energy tools already handle well. | You need site-specific telemetry, forecasting, optimization, IoT control loops, or operational decision support. |
| Assurance readiness | A vendor's built-in controls and audit exports match the assurance process. | You need custom evidence models, approval chains, immutable calculation history, or external stakeholder portals. |
Price Energy Data Resolution Before You Commit
Energy-management competitors increasingly frame cost around meter count, sensor coverage, sampling interval, and control-loop ambition. Treat those as budget variables before approving a broad greentech roadmap. A monthly utility-bill import can support executive reporting, but five-minute interval data across mixed meters, solar assets, batteries, HVAC systems, and facility controls needs ingestion monitoring, time-series storage, gap filling, alert thresholds, and site-level exception handling.
Start with a pilot group that proves the highest-value operating decision: waste detection, demand peak alerts, equipment anomaly triage, facility benchmarking, or savings verification. Then compare the subscription route with the custom software vs off-the-shelf total cost tradeoff before adding proprietary forecasting or optimization logic. This keeps the first release tied to measurable energy decisions instead of overbuilding a dashboard that cannot yet trust its data.
| Energy Data Choice | Budget Risk | Scope-Control Move |
|---|---|---|
| Monthly bills or CSV imports | Lower engineering cost, but weaker operational insight and delayed exception detection. | Use it for baseline reporting and executive visibility. |
| Hourly or sub-hourly meter data | Raises storage, validation, aggregation, and alerting complexity. | Pilot only the sites and meters tied to the first savings decision. |
| Real-time controls or optimization | Adds device reliability, safety review, monitoring, rollback, and operational support cost. | Defer control loops until monitoring data quality is proven. |
| Multi-site portfolio benchmarking | Requires normalization for site type, weather, production volume, occupancy, and tariffs. | Define the comparison model before building cross-site leaderboards. |
Design For Assurance-Ready Data Models
In 2026, greentech software buyers are no longer comparing only dashboard features. They are asking whether emissions, energy, supplier, and ESG data can survive finance review, customer diligence, and assurance workflows. IFRS S2 climate disclosures, GHG Protocol Scope 3 guidance, and buyer expectations around evidence trails all push the software toward stronger lineage, calculation versioning, role-based review, and reproducible exports.
That changes the cost conversation. A sustainability dashboard can show trends quickly, but an assurance-ready platform must explain where each number came from, which boundary and factor set were used, who approved the evidence, what changed since the last reporting period, and how exceptions were resolved. Budget for these controls before adding advanced forecasting or AI assistance, because weak data governance will make every later module harder to trust.
Where AI Belongs In A Greentech Platform
AI can improve a greentech product, but it should not be the first thing trusted with emissions totals, evidence approval, or disclosure outputs. Use AI after the data model, calculation rules, review workflow, and audit trail are reliable. Good first AI features include anomaly detection for meter gaps, supplier-response triage, evidence classification, natural-language dashboard explanations, reduction-plan suggestions, and forecast alerts that still route through human review.
The safest pattern is to treat AI as decision support around governed data, not as the system of record. A carbon or ESG platform should keep source files, factor versions, calculation outputs, approvals, and exports deterministic. AI can then help users find exceptions, summarize changes, detect suspicious data, or prioritize follow-up work. If the workflow has enough repeated effort to justify automation, estimate it with the AI Automation ROI Calculator before adding model infrastructure to the first release.
| AI Use Case | Good First Release? | Guardrail To Budget For |
|---|---|---|
| Meter anomaly detection | Yes, when historical telemetry exists. | Human approval before changing reported values. |
| Supplier evidence triage | Yes, for routing and completeness checks. | Keep original documents and reviewer decisions traceable. |
| Emission factor suggestions | Sometimes, after methodology is defined. | Require factor provenance, versioning, and reviewer sign-off. |
| Disclosure narrative drafting | Useful as an assistant, not a source of truth. | Tie summaries back to approved metrics, evidence, and risk owners. |
| Automated ESG scoring | Defer unless the scoring model is explainable. | Document inputs, thresholds, overrides, and appeal paths. |
For teams building forecasting, anomaly detection, LLM assistants, or supplier-data copilots into sustainability software, NextPage's AI development services and AI automation services are a better fit once the carbon, energy, or ESG workflow has a stable operating loop.
What 2026 Buyers Should Budget For
In 2026, sustainability software buyers are not only comparing dashboard features. They are asking whether the platform can collect Scope 3 supplier data, preserve calculation evidence, support assurance reviews, and adapt when disclosure requirements shift across regions. That changes the budget conversation. A low-cost reporting UI can be useful for internal visibility, but buyer-grade greentech software needs governed data intake, versioned factors, exception handling, access controls, exports, and a clear ownership model.
Use subscription tools when the process matches a standard carbon accounting or ESG reporting workflow. Plan a custom layer when the product needs proprietary reduction logic, customer-facing sustainability portals, IoT energy telemetry, unusual supplier workflows, or operating dashboards that generic tools cannot model. For custom builds, connect the scope to owned software architecture, dashboard architecture, and workflow automation instead of treating ESG reporting as a standalone screen set.
| 2026 Requirement | Cost Impact | Scope-Control Move |
|---|---|---|
| Scope 3 supplier evidence | Supplier portals, reminders, file validation, and review queues add workflow and data-model work. | Start with one supplier category and one evidence template before expanding. |
| Assurance-ready audit trails | Every calculation, emission factor, approval, and export needs traceability. | Version methodology and evidence from day one, even in the MVP. |
| IoT or meter telemetry | Device access, time-series storage, anomaly handling, and alert logic raise engineering effort. | Pilot a small site group before committing to portfolio-wide ingestion. |
| Multi-standard reporting | CSRD, ISSB, GRI, CDP, or customer-specific exports can multiply mapping and QA work. | Choose the first required report family and design a reusable export layer. |
A Practical MVP Roadmap
The safest first release proves one complete operating loop. For a carbon-tracking product, that loop might be data import, normalization, calculation, review, dashboard, and report export. For an energy platform, it might be meter ingestion, site dashboard, anomaly detection, alert routing, and savings report. For ESG workflow software, it might be request assignment, evidence upload, approval, audit trail, and disclosure-ready export.
Phase 1: discovery and data inventory. List the reporting goals, data sources, user roles, integration owners, frequency, evidence requirements, and current spreadsheet workflows. Identify which metrics are business-critical and which are nice to have.
Phase 2: data model and methodology. Define entities such as sites, assets, meters, suppliers, activities, factors, emissions, evidence, initiatives, reports, and approvals. Decide how calculation versions, units, boundaries, and assumptions are stored.
Phase 3: first workflow release. Build one end-to-end flow with real data: import, validation, calculation, review, dashboard, and export. Use NextPage's MVP Scope Builder to trim features that do not prove the first operating loop.
Phase 4: integrations and automation. Add scheduled imports, utility or IoT feeds, ERP/procurement connections, supplier requests, notifications, anomaly alerts, and workflow approvals. If the workflow is still mostly approvals, requests, and exception routing, NextPage's business process automation services can help scope the first release before a full sustainability platform is justified.
Phase 5: scale and intelligence. Add forecasting, reduction-planning simulations, portfolio benchmarks, scenario modeling, role-specific portals, APIs, and advanced governance.
Carbon Tracking, Energy Dashboards, And ESG Workflows Are Different Builds
A carbon tracking system is calculation-heavy. It needs activity data, factor libraries, unit conversion, period boundaries, source evidence, and repeatable reporting. A dashboard that only displays totals may be easy; a system that explains exactly how each total was calculated is harder and more valuable.
An energy dashboard is time-series and operations-heavy. It may need near-real-time ingestion, device health checks, missing-data handling, alerts, seasonality, site comparisons, and operational workflows. NextPage's renewable energy software development cost guide covers similar data and rollout patterns for energy management, forecasting, and grid reporting systems.
An ESG workflow system is governance-heavy. It needs assignments, evidence, approvals, comments, document retention, permissioning, and audit trails. The dashboard matters, but the workflow behind the data is what makes the report trustworthy.
Trying to build all three as a first release usually creates a large budget and a slow launch. A better path is to choose the first reporting or operations outcome, then design the platform so future modules can reuse the same data and identity foundation.
Architecture Decisions That Affect Cost
Greentech platforms usually need a more disciplined backend than a standard CRUD app. Data may arrive from files, APIs, devices, partner systems, or manual forms. It may need validation, deduplication, unit conversion, anomaly detection, and versioned calculations before it becomes dashboard-ready.
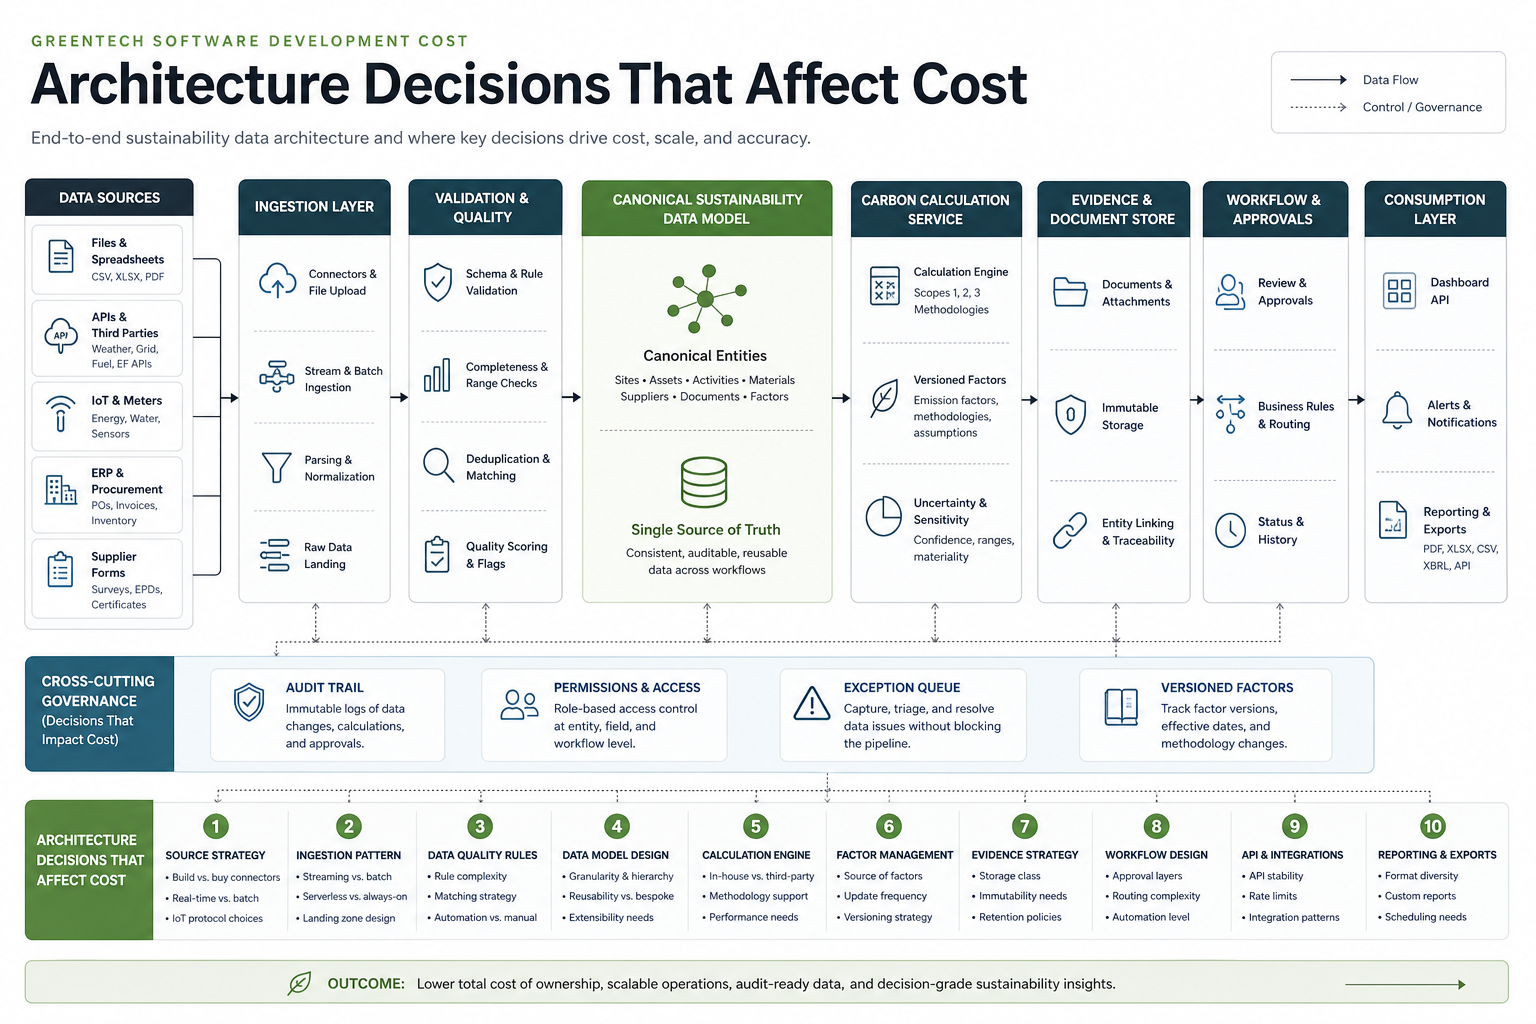
A practical architecture includes an ingestion layer, validation rules, canonical data model, calculation service, workflow engine, dashboard API, evidence store, permissions model, and audit log. For IoT or energy use cases, add time-series storage, device registry, alerting, and monitoring. For commercial SaaS, add tenant isolation, billing, admin tooling, and customer support workflows.
The dashboard layer should be designed around decisions rather than charts. Sustainability leaders need baselines, trend lines, target progress, and exception summaries. Operations teams need alerts, facility views, asset health, and action queues. Finance and audit teams need source evidence, calculation history, approvals, and exports. When the reporting experience needs to become a product-grade application, NextPage's custom dashboard development services are a better fit than a disconnected BI-only build. For an adjacent operations-console pattern, the ClearRoute portfolio case study shows how field evidence, processing status, maps, and review workflows can become one decision surface.
The design should also include failure handling. What happens when a supplier submits incomplete data, a meter stops reporting, an emissions factor changes, or an ERP import fails? Exception workflows and admin visibility often save more support time than another dashboard chart.
Procurement And Assurance Evidence Buyers Ask For
Procurement and finance teams now evaluate greentech platforms by the evidence they can defend, not only by the dashboard they can show. Before a buyer approves custom sustainability software, they will usually ask how supplier files are collected, how emissions factors are versioned, how calculation changes are reviewed, how exceptions are resolved, and how the system can export evidence for assurance, customer diligence, or board reporting.
That means the MVP should include an evidence contract. Define the source system, owner, refresh cadence, validation rule, approval step, and export format for every metric that will appear in a customer, investor, or compliance-facing report. If the same workflow repeats across suppliers, sites, or business units, treat the intake and review loop like AI workflow automation with human approval rather than a static upload form.
Design A 2026 Reporting Evidence Readiness Matrix
Because the European Commission is still simplifying ESRS implementation while IFRS S2 is already effective in adopting jurisdictions, greentech software should avoid hard-coding one report layout as the product architecture. A safer 2026 build is an evidence layer that can map the same activity data, emission factors, supplier attestations, approval trail, and export pack to CSRD/ESRS, IFRS S2, Scope 3, or buyer diligence requirements as rules evolve.
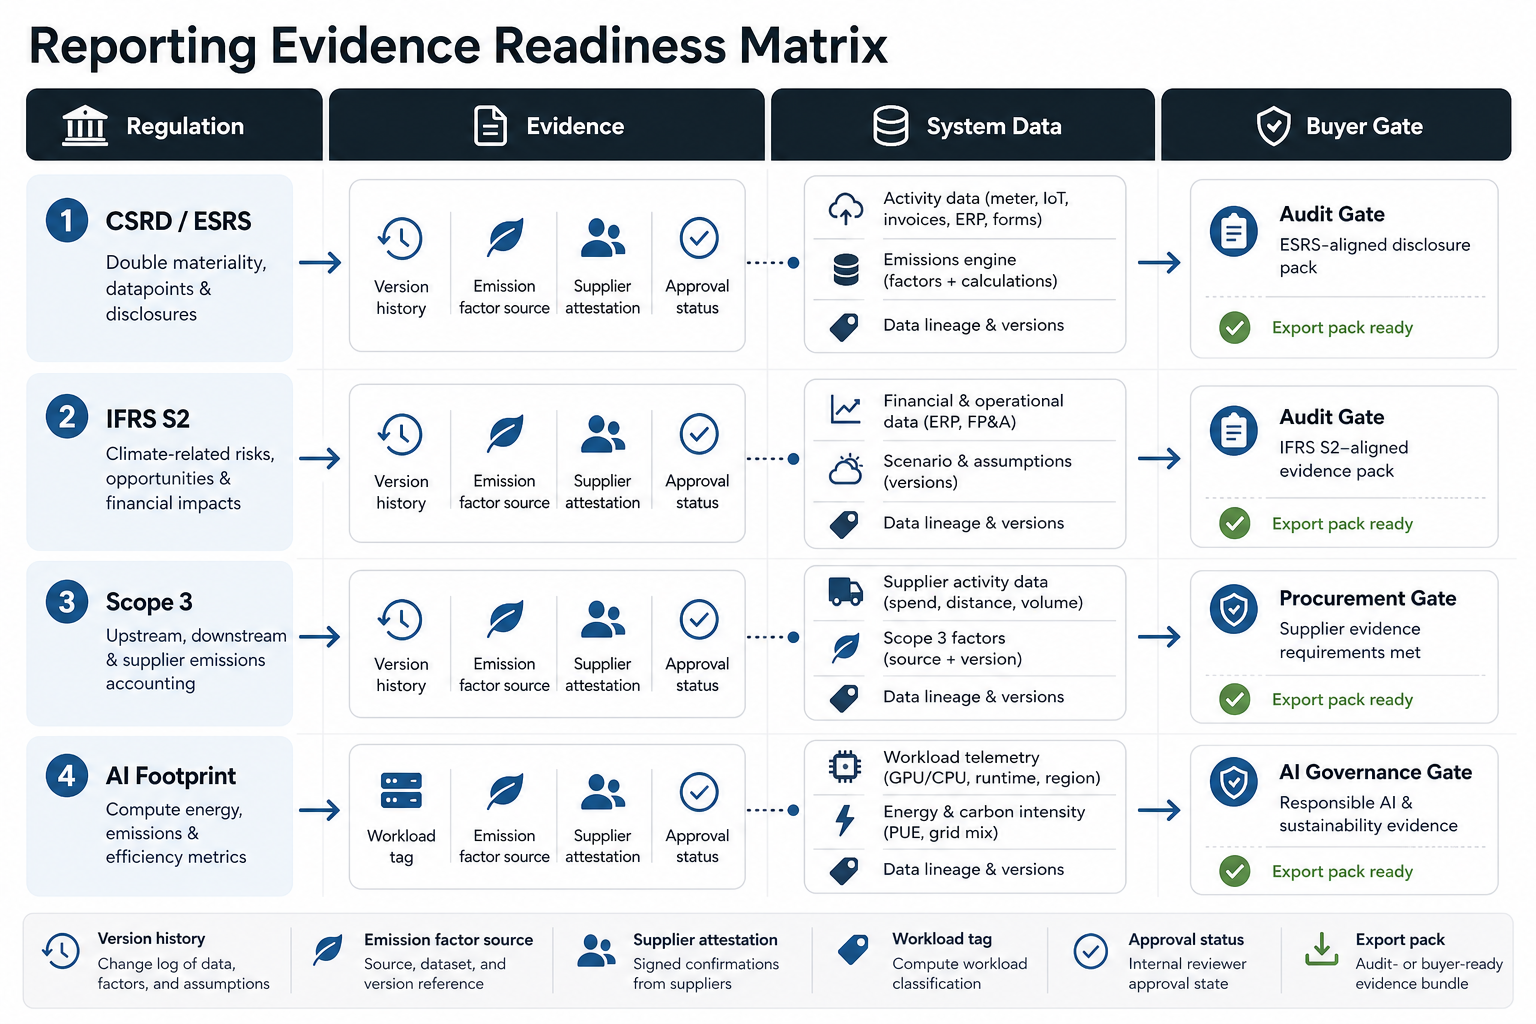
For Scope 3-heavy products, budget for source-category mapping, factor provenance, supplier confirmations, data-lineage versions, and reviewer sign-off before adding advanced forecasting. For AI-enabled greentech products, add workload tags, cloud-region usage, energy context, and human approval states so AI footprint evidence can live beside carbon, energy, and ESG workflow evidence instead of becoming a separate manual spreadsheet.
| Evidence Buyers Ask For | Software Capability To Budget | Why It Protects The Launch |
|---|---|---|
| Supplier Scope 3 files and questionnaire responses | Supplier portal, reminders, file validation, exception queue, and reviewer comments. | Prevents the platform from becoming another spreadsheet chase during reporting season. |
| Calculation methodology and factor provenance | Versioned factor library, boundary settings, unit conversion, and change history. | Makes reported values reproducible when methodology or reporting scope changes. |
| Energy, meter, ERP, or procurement imports | Integration monitoring, retries, mapping logs, and row-level error handling. | Keeps dashboards trustworthy when source data is late, duplicated, or malformed. |
| Executive and audit-ready dashboards | Role-based views, exportable tables, narrative notes, and evidence drill-downs. | Helps leaders act on trends while finance and auditors can inspect the underlying proof. |
| Assurance handoff | Permissioned evidence packs, calculation snapshots, approval trail, and immutable exports. | Reduces rework when external reviewers ask how a number was produced. |
If the main decision surface is reporting-heavy, compare a Power BI vs custom dashboard app approach before building a full product. Use BI for governed internal reporting when the workflow is stable. Build a custom portal when suppliers, customers, facility teams, auditors, or product users need to act inside the same system that stores the evidence.
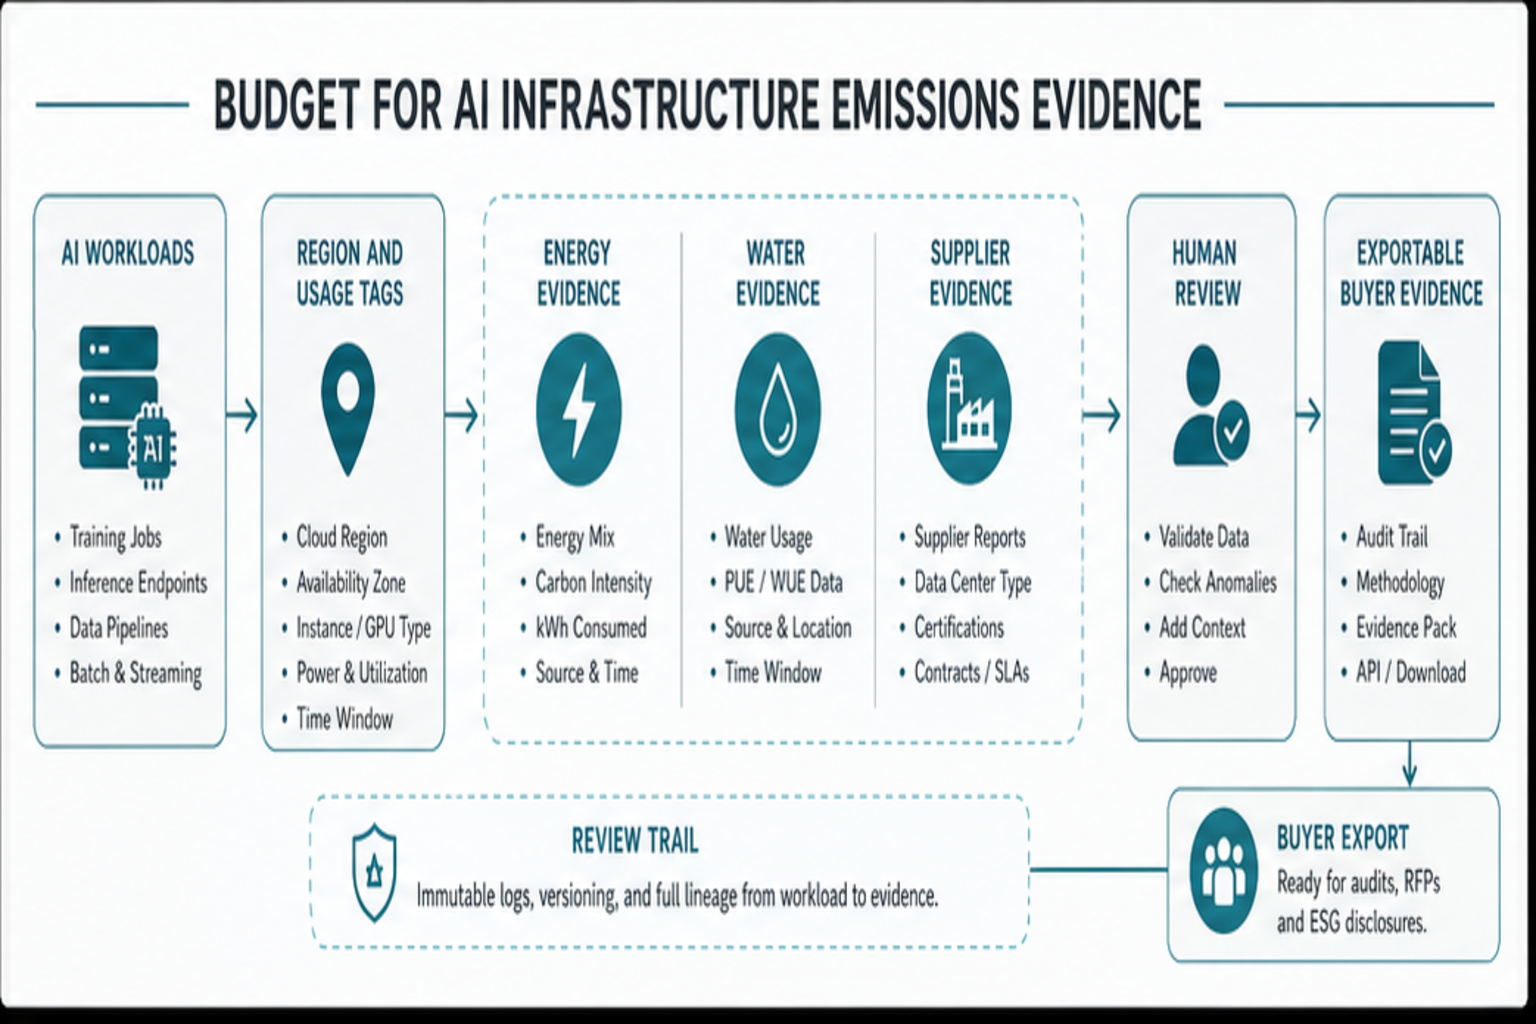
Budget For AI Infrastructure Emissions Evidence
AI is now part of the greentech software buying conversation because cloud and model infrastructure can change the footprint that customers, auditors, and procurement teams ask about. In 2026, buyers are paying closer attention to electricity use, water use, data center location, hardware lifecycle, supplier emissions, and whether renewable energy claims are tied to traceable evidence. IEA energy-and-AI analysis also keeps data-center electricity demand on the board as a real planning constraint, including sensitivity cases where global data-center demand in 2035 is materially higher than the base case. If your product uses forecasting models, anomaly detection, document classification, or LLM assistants, budget for evidence capture around those workloads instead of treating AI as an invisible feature cost. For sustainability product teams, the same IEA outlook matters because global electricity generation to supply data centers is projected to rise from 460 TWh in 2024 to more than 1,000 TWh in 2030 and 1,300 TWh in 2035 in its Base Case.
| Evidence Buyer May Ask For | Software Capability To Budget | Scope-Control Move |
|---|---|---|
| AI workload energy and location | Cloud-region tagging, workload logs, usage attribution, and exportable calculation inputs. | Track the highest-volume AI jobs first before modeling every background task. |
| Hardware and supplier footprint | Vendor metadata fields, supplier questionnaires, attachment storage, and review status. | Capture source documents and methodology versions before adding scoring automation. |
| Water, cooling, and local grid risk | Facility or provider evidence fields, regional risk notes, and exception workflows. | Start with procurement evidence, then add automated risk flags when data quality improves. |
| AI output governance | Human review queues, prompt/version records, override logs, and approved disclosure exports. | Use machine learning development services only after the deterministic reporting workflow is stable. |
This does not mean every greentech MVP needs a full AI carbon model. It means the architecture should leave room for workload tags, evidence fields, methodology versions, and reviewer sign-off so the platform can answer buyer questions later without a rebuild.
Implementation Checklist
- Define the first business outcome: carbon baseline, energy savings, audit-ready ESG evidence, or customer-facing sustainability product.
- Inventory all data sources, owners, update frequency, formats, and current quality issues.
- Document emissions factors, units, boundaries, assumptions, and calculation versioning requirements.
- Map user roles: sustainability manager, facilities operator, finance reviewer, supplier, auditor, executive, and admin.
- Choose the first complete workflow and defer secondary modules.
- Plan import validation, exception queues, audit logs, evidence storage, permissioning, and recalculation triggers early.
- Define a 2026 reporting evidence gate: source owner, factor version, reviewer, exception policy, export format, and retention period for each external-facing metric.
- Decide which integrations need real-time behavior and which can run as scheduled sync jobs.
- Measure success with adoption, reporting time saved, data completeness, exception rate, energy savings, and audit-readiness.
If you are still deciding which workflow is automation-ready, run the Workflow Automation Opportunity Finder before estimating the full platform. It helps separate repeatable approval and evidence tasks from platform features that need deeper data engineering.
How NextPage Can Help
NextPage helps teams scope and build custom sustainability software, data dashboards, workflow automation, customer portals, integrations, and scalable web applications. A practical engagement starts with discovery, data inventory, MVP scope, architecture, and budget modeling before implementation.
If the first release is a product dashboard, customer portal, workflow-heavy internal platform, or commercial sustainability product, NextPage can help design the roadmap, shape the MVP development plan, build the data layer, ship the web application, and extend it into SaaS development services when multi-tenant product requirements appear. For teams comparing in-house delivery with an external partner, the IT outsourcing services page outlines how software, web, mobile, QA, AI, and automation delivery can be structured.