
Quick Answer: How Do You Measure Social Media ROI Across The Full Funnel?
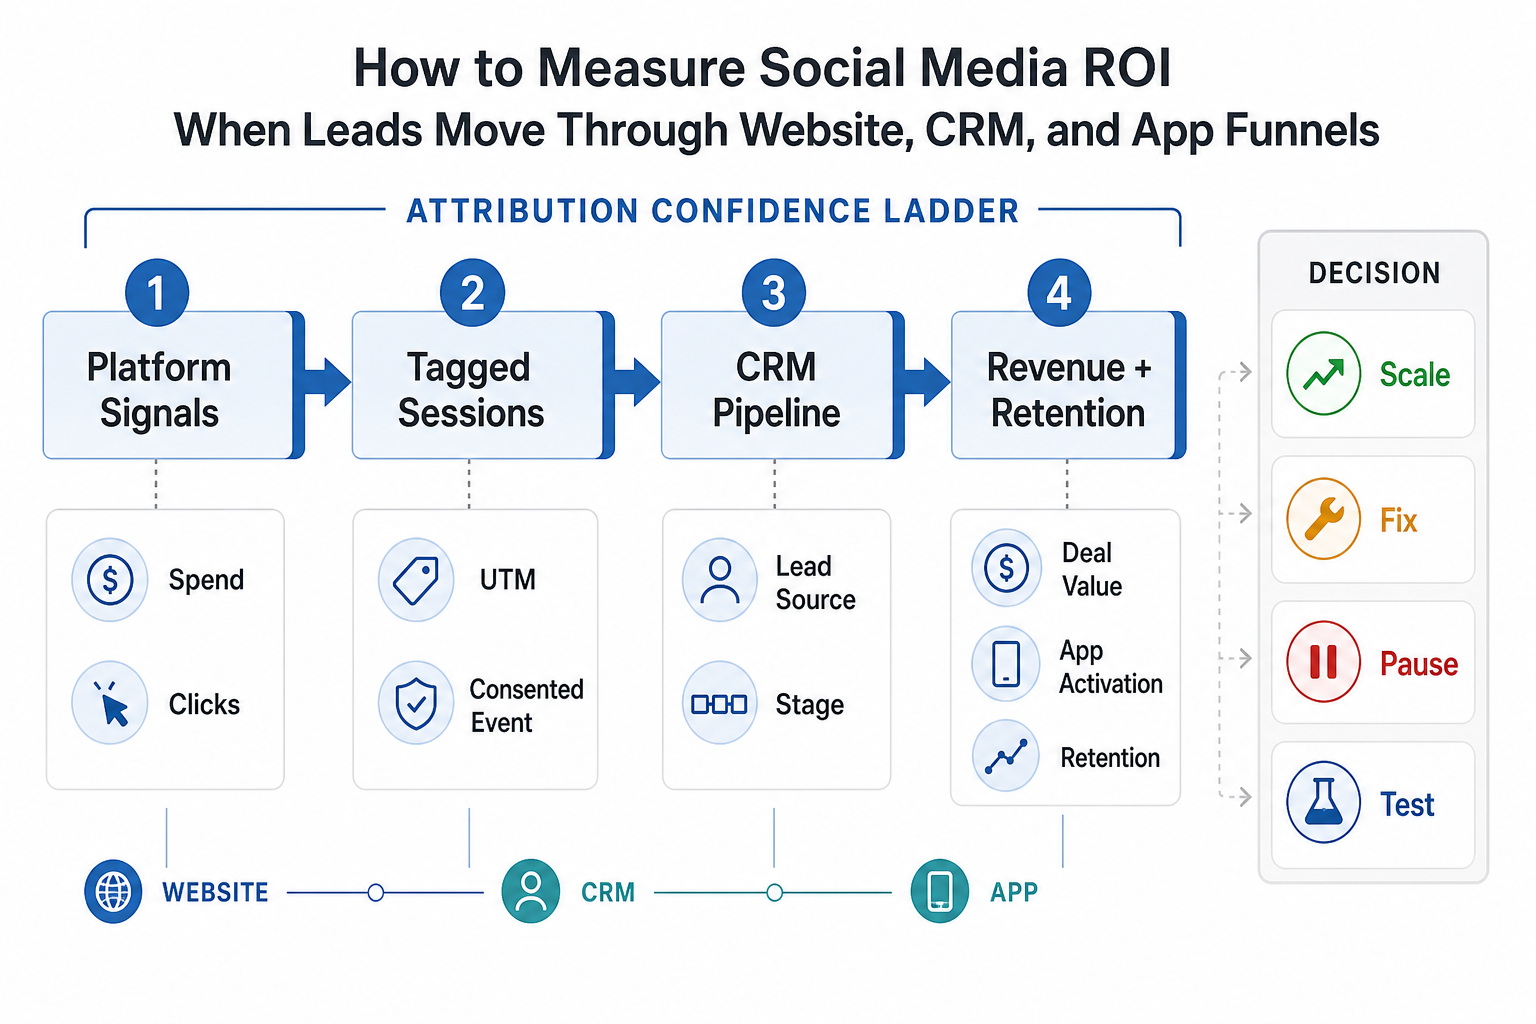
Measure social media ROI by connecting social campaign cost and effort to qualified website conversions, CRM pipeline, app or product activation, and closed revenue. Platform metrics such as reach, engagement, followers, video views, and click-through rate are useful diagnostic signals, but they are not ROI by themselves. ROI needs a traceable chain from campaign source to business outcome, plus a stated confidence level for how much of that chain is directly observed versus inferred.
A practical formula is: social media ROI = attributed revenue minus campaign, creative, media, tool, and delivery cost, divided by total cost. The hard part is not the arithmetic. The hard part is creating evidence that the revenue was influenced by social activity, that leads were captured cleanly, that CRM stages were updated consistently, and that app or website events show real buyer intent. In 2026, strong reports should also show what the attribution model can and cannot see: cross-device journeys, delayed sales cycles, offline conversations, dark social sharing, and consent gaps.
For NextPage clients, the strongest measurement setup usually combines four systems: tagged campaign links, conversion-ready landing pages, CRM stage discipline, and a decision-ready dashboard that separates awareness signals from revenue signals. If one of those systems is missing, teams often optimize for cheap traffic instead of profitable pipeline. Teams running active launch campaigns should connect this measurement plan to social media marketing services for app and web launches so channel work, landing pages, and reporting are scoped together.
Why Platform Metrics Are Not Enough
Social platforms are good at reporting activity inside their own environment. They can show impressions, clicks, engagement, follower growth, video completion, ad spend, and audience segments. Those numbers help marketers improve creative and targeting, but they do not answer the commercial question: did this campaign create qualified demand that moved through the business?
The gap appears when a click leaves the platform. A user may visit a landing page, return later from search, speak to sales, try a product workflow, join a webinar, or become part of a buying committee. If tracking stops at the first click, the campaign receives too much credit for weak leads or too little credit for long-cycle opportunities.
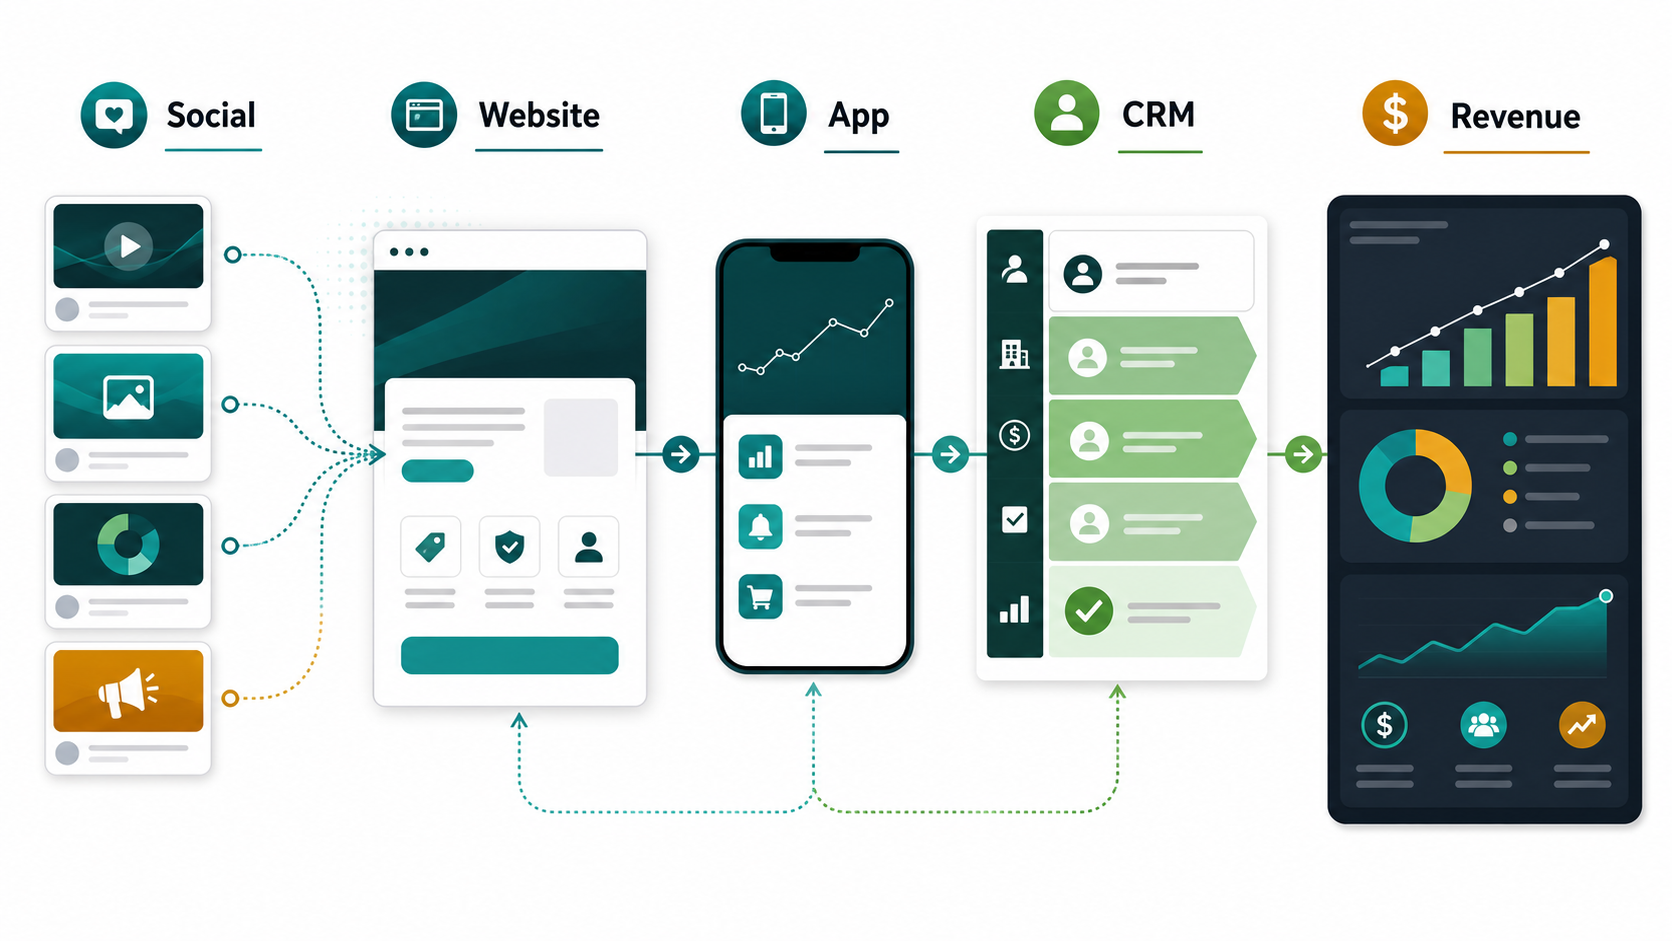
This is why social ROI measurement belongs inside the wider digital system. A food commerce team, for example, might use social campaigns to trigger app installs, menu views, offer redemptions, and repeat orders. The operational lesson is similar to the one in NextPage's guide to social media integration in a pizza delivery app: social touchpoints should be connected to downstream actions, not treated as a separate vanity channel.
The Measurement Architecture: From Post To Revenue
A reliable social ROI model has a chain of evidence. Each layer needs naming rules, ownership, and a small set of metrics that are trusted by marketing, product, and sales.
| Layer | What To Capture | Why It Matters |
|---|---|---|
| Campaign source | Platform, campaign, creative, audience, UTM parameters, paid or organic label, cost, owner, and launch date | Separates channel performance and prevents unattributed traffic from being grouped into one vague social bucket |
| Website or landing page | Sessions, engaged visits, content depth, form starts, form submissions, booked calls, downloads, chat starts, and source path | Shows whether social traffic converts when it reaches owned pages |
| App or product funnel | Install, signup, activation, key feature use, trial conversion, retention, referrals, and revenue events | Connects social activity to product behavior, not just lead capture |
| CRM pipeline | Lead source, campaign, lifecycle stage, MQL, SQL, opportunity, deal value, close date, lost reason, and sales notes | Reveals lead quality and sales outcomes that web analytics cannot see alone |
| Finance and delivery cost | Ad spend, creative cost, agency or team time, tools, landing page work, CRM work, and fulfillment cost | Makes ROI honest by including the real cost of producing results |
The goal is not perfect attribution. The goal is a measurement system that is consistent enough to guide decisions. If the same naming rules, event definitions, and CRM fields are used every month, trends become visible even when individual buyer journeys are complex. For regulated or privacy-sensitive campaigns, add consent status, channel permissions, retention windows, server-side event rules, and offline conversion imports to the architecture so reporting remains useful without depending only on third-party cookies.
Build The Tracking Foundation First
Start with UTM governance. Every campaign link should identify the source, medium, campaign, content or creative, and paid versus organic status. Keep naming short, lowercase, and stable. Do not let every agency, freelancer, or platform manager create their own labels. Inconsistent UTMs are one of the fastest ways to make a dashboard untrustworthy.
Next, map conversion events. For a service business, events might include service page visits, pricing or estimator use, consultation bookings, downloadable checklist requests, and contact form submissions. For a SaaS or app business, events might include signup, activation, invite sent, integration connected, trial started, payment added, and subscription conversion. For commerce teams, include owned-cart and repeat-purchase events so social demand can be compared with the product flow behind social commerce app development services.
Analytics planning should happen before the build or campaign launch, not after. The same principle applies when scoping a product build: NextPage's mobile app development RFP checklist recommends defining analytics, events, funnels, dashboards, and review cadence up front so success measurement is not bolted on later. If measurement is tied to a new product, landing page, or internal workflow, the MVP Scope Builder can help turn funnel events into a practical first-release scope.
A Four-Layer Social ROI Measurement Framework
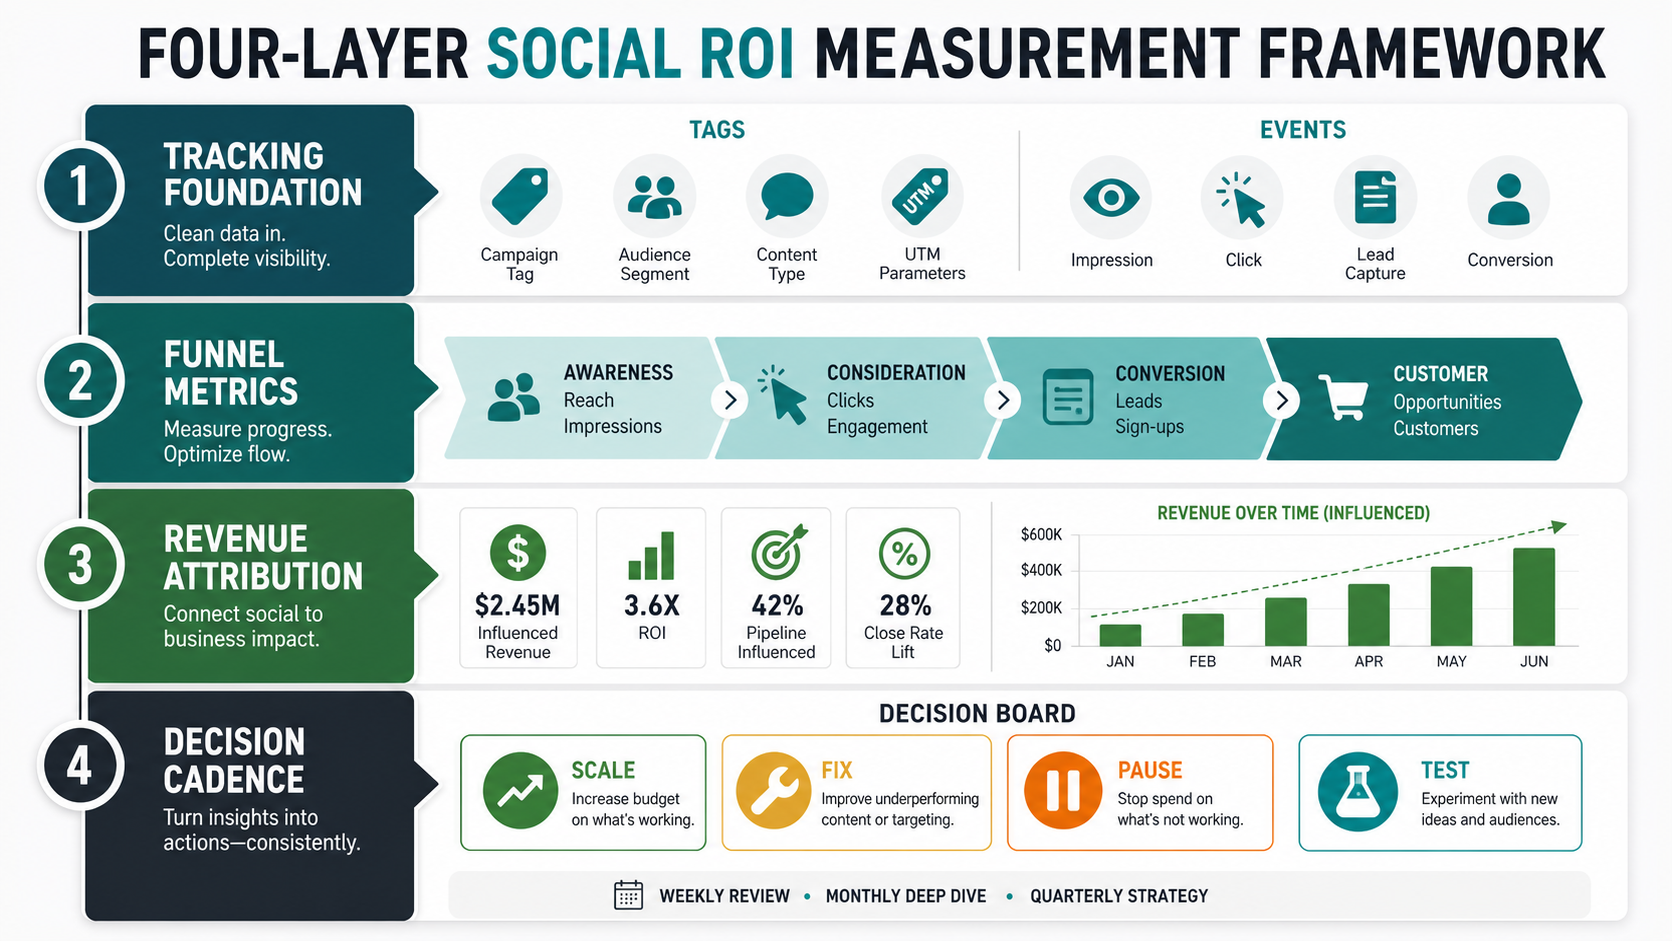
Use four layers to keep reporting practical.
- Tracking foundation: UTM rules, event taxonomy, landing page source fields, CRM source fields, app analytics, and consent-aware data capture.
- Funnel metrics: traffic quality, conversion rate, lead quality, response time, pipeline velocity, activation rate, and retention behavior.
- Revenue attribution: opportunity value, closed revenue, assisted revenue, CAC, LTV, payback period, and campaign delivery cost.
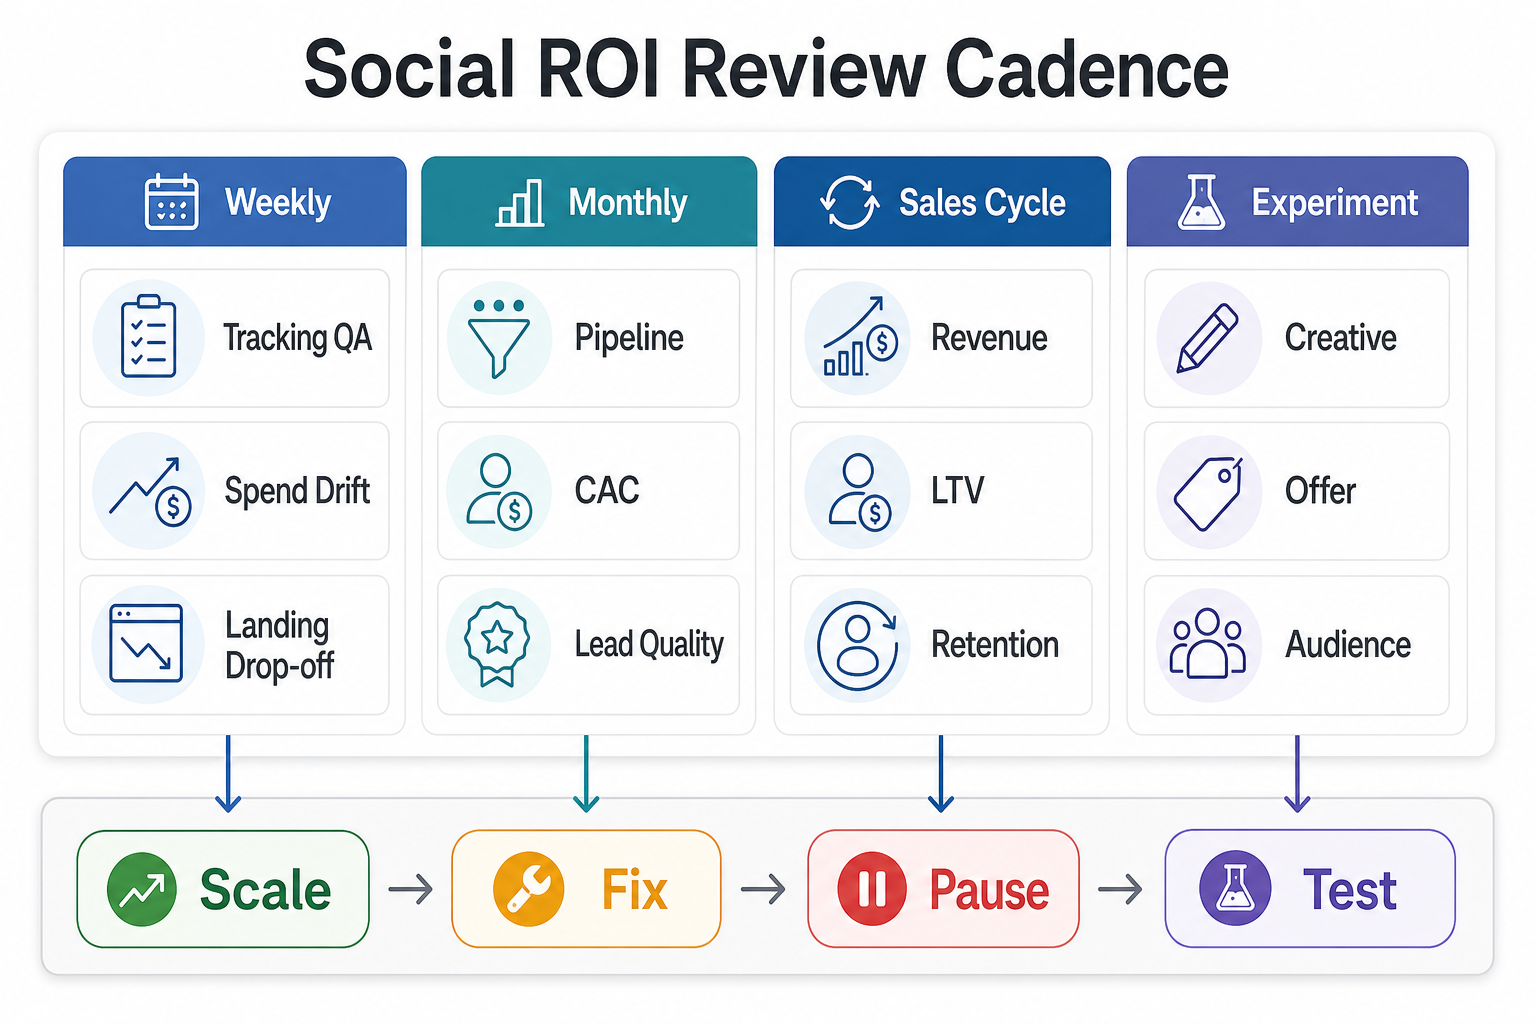
- Decision cadence: a monthly rhythm for learning what to fix, scale, pause, or test next.
This framework keeps teams from jumping straight to an ROI percentage before the evidence is ready. A campaign with high engagement but poor lead quality may need a better landing page or offer. A campaign with low volume but strong sales conversion may deserve more budget. A campaign with good first conversions but weak retention may need product or onboarding changes rather than new ad creative. A practical 2026 dashboard should also show data-confidence flags such as missing consent, broken UTM values, unmatched CRM records, offline conversions not synced, platform-attributed conversions not matched to CRM outcomes, and campaigns still inside the sales-cycle window.
Metrics To Track By Funnel Stage
The best dashboard groups metrics by decision, not by tool. Executives need revenue and payback. Marketing needs campaign and creative performance. Sales needs lead quality and follow-up speed. Product teams need activation and retention. One dashboard can serve all of them if it separates the layers clearly.
| Stage | Useful Metrics | Decision It Supports |
|---|---|---|
| Awareness | Reach, frequency, profile visits, video completion, audience growth, share of engaged audience | Whether the creative and audience are earning attention |
| Traffic | CTR, CPC, engaged sessions, landing page scroll depth, bounce quality, returning visitor share | Whether clicks are relevant enough to continue investing |
| Conversion | Form conversion, booked calls, demo requests, checklist downloads, signup rate, activation event completion | Whether the offer and page turn attention into owned demand |
| Lead Quality | MQL rate, SQL rate, disqualification reasons, response time, buyer fit, sales acceptance | Whether the campaign is attracting the right audience |
| Revenue | Pipeline, win rate, deal value, CAC, LTV, payback period, retained revenue | Whether the channel creates profitable growth |
Do not report every metric with equal weight. Choose a primary metric for the campaign goal and a few guardrails that prevent false positives. For example, if a campaign is built to generate discovery calls, booked calls may be the primary metric while SQL rate, no-show rate, deal value, and eventual retention act as guardrails. For app-led funnels, pair acquisition metrics with activation and retained usage before judging whether social traffic is commercially healthy.
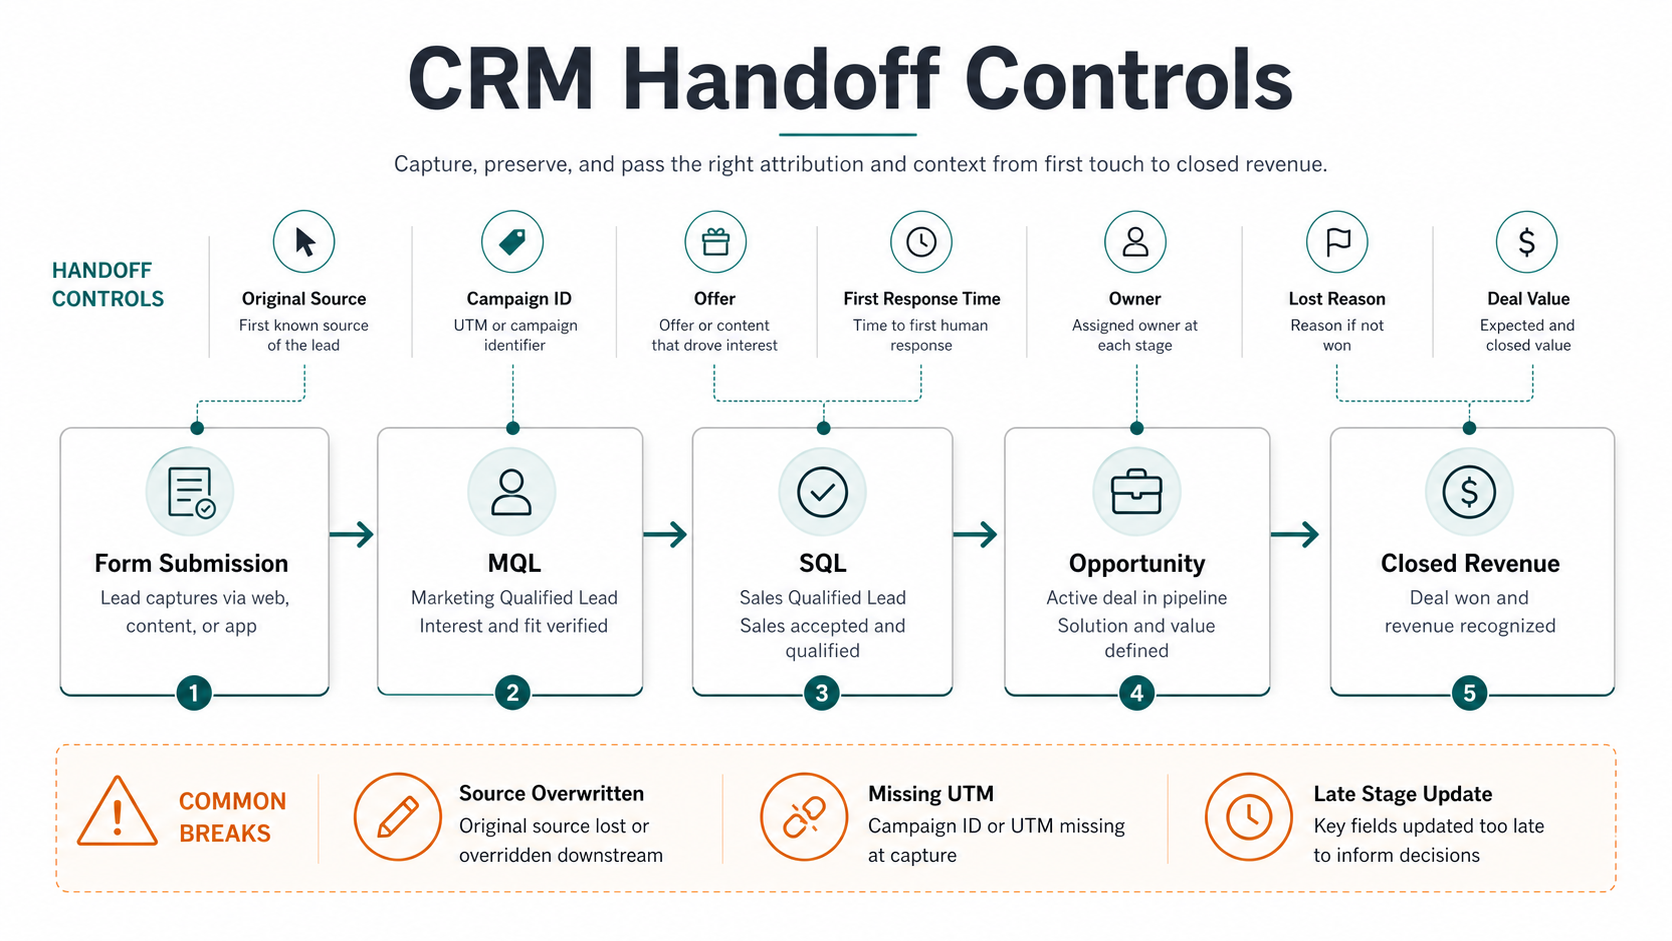
Make CRM Handoff Part Of The ROI Model
Many social ROI problems are CRM problems in disguise. The campaign may generate the right lead, but the source is overwritten, the form does not capture campaign context, sales changes the stage late, or closed revenue never maps back to the original campaign. The result is a dashboard that underreports social contribution.
At minimum, CRM records should preserve original source, latest source, campaign name, landing page, offer, form type, lifecycle stage, owner, first response time, opportunity value, close date, and lost reason. For B2B campaigns, add buying role, company size, service interest, budget readiness, timeline, and fit score. Treat these fields as handoff controls, not optional notes, because every missing field weakens attribution and follow-up quality. If sales creates opportunities from calls, WhatsApp, events, or referrals influenced by social content, define a manual source-correction workflow instead of letting those deals disappear into direct or unknown revenue.
Lead quality is more important than raw lead count. A campaign that produces 200 unqualified leads can look successful in marketing analytics and harmful in sales operations. A campaign that produces 20 high-fit conversations can be more valuable even when platform metrics look modest. When CRM, ad-platform, and web analytics disagree, a marketing analytics dashboard for attribution, ROI, and lead quality should make the source of truth and exception queue visible instead of hiding mismatches in blended reports. Teams adding automated sales follow-up should also review the AI sales agent implementation roadmap so routing, human approval, and ROI measurement stay aligned.
Separate Paid, Organic, Influencer, And Community Social
Social is not one channel. Paid acquisition, organic content, founder-led posting, employee advocacy, influencer activity, partnerships, and community engagement have different costs and attribution patterns. A single blended ROI number hides those differences. Launch teams can keep this cleaner by pairing every channel motion with a planned destination, cadence, and conversion path, as described in the social media content calendar for product launches.
| Social Motion | Typical Cost To Include | Best Success Signal |
|---|---|---|
| Paid social | Ad spend, creative, landing page work, campaign management, tooling | Qualified pipeline, CAC, payback, and scalable cost per accepted lead |
| Organic content | Strategy, copy, design, scheduling, subject matter expert time | Assisted conversions, branded demand, engaged returning visitors, inbound conversation quality |
| Influencer or partner activity | Fees, commissions, samples, campaign operations, tracking setup | Tracked conversions, coupon or referral quality, audience fit, retention after first purchase |
| Community engagement | Moderator time, expert participation, content support, support workflows | Trust, referrals, support deflection, product feedback, customer expansion |
Separate reporting does not mean every touch needs a perfect last-click value. It means the team can compare each motion against the outcome it is designed to influence.
Design The Dashboard Around Decisions
A social ROI dashboard should help the team decide what to scale, fix, pause, or test next. That usually requires three views.
- Executive view: total spend and effort, attributed pipeline, closed revenue, CAC, LTV, payback, and top lessons.
- Campaign view: performance by platform, audience, creative, landing page, offer, and funnel stage.
- Operations view: tracking gaps, missing UTMs, unassigned CRM source, slow lead response, form issues, and event failures.
Dashboards fail when they only show positive metrics. Include warnings: leads with missing source, campaigns with inconsistent naming, pages with low conversion, CRM stages not updated, and cohorts with weak retention. Those warnings are often more valuable than a polished chart because they show exactly where the measurement system needs repair. When reporting needs to combine CRM, app, finance, and operational actions, compare custom dashboard development services, Power BI consulting services, and standard BI using NextPage's guide to Power BI vs custom dashboard apps.
Common Mistakes That Distort Social Media ROI
- Calling engagement or follower growth ROI without connecting it to pipeline, revenue, retention, or another business outcome.
- Using inconsistent UTM naming across platforms, campaigns, agencies, and internal teams.
- Counting all leads equally instead of tracking sales acceptance, disqualification reasons, and deal value.
- Ignoring creative, management, landing page, CRM, analytics, and tool costs in the ROI formula.
- Letting CRM source fields be overwritten without preserving original campaign context.
- Comparing paid social, organic content, influencer activity, and community engagement as if they have the same job.
- Reviewing campaign data too early for long-cycle B2B offers or too late for fast-moving paid campaigns.
- Ignoring consent status, offline conversion imports, server-side event health, and CRM sync errors when privacy changes reduce browser-side tracking coverage.
Social Media ROI Measurement Checklist
- Define the business goal before campaign launch: pipeline, revenue, app activation, repeat purchase, retention, or qualified consultation.
- Create UTM naming rules and require them for every campaign link.
- Map the website, landing page, and app events that prove meaningful intent.
- Preserve original source, latest source, campaign, offer, and landing page inside the CRM.
- Separate paid, organic, influencer, partner, and community reporting.
- Include full delivery cost, not only ad spend.
- Choose primary metrics and guardrails for each funnel stage.
- Review tracking gaps monthly before debating campaign performance.
- Use the dashboard to decide what to fix, scale, pause, or test next.
- Document the attribution window, attribution model, offline conversion sync status, and confidence level before presenting ROI to leadership.
How NextPage Helps Connect Social Campaigns To Revenue Evidence
NextPage helps teams connect social campaigns to the owned systems that prove business value: campaign landing pages, conversion events, CRM fields, product analytics, dashboards, and review workflows. The work is part marketing operations, part software architecture, and part reporting discipline.
If social campaigns are bringing traffic but the team cannot see which efforts create qualified leads, booked calls, app activation, or revenue, the first step is not always more ad spend. It may be a tracking audit, a landing page rebuild, CRM source cleanup, campaign analytics repair, a mobile funnel review with a mobile app development company, or a better lead-quality workflow.
Audit your social media ROI tracking gaps with NextPage, scope the reporting layer with marketing analytics dashboard development, or use the MVP Scope Builder if the measurement work is tied to a new app, landing page, or internal dashboard build.