
Quick Answer: What A Mobile App Performance Checklist Should Cover
A mobile app performance optimization checklist should cover the full user path, not only image compression or a late load test. The practical version sets budgets for cold start, first usable screen, tap-to-response latency, API round trips, media weight, memory, battery use, crash and ANR signals, offline recovery, and release monitoring. Each budget needs an owner, a measurement tool, and a clear pass/fail gate before the app ships.
This guide is for founders, product managers, CTOs, and mobile teams preparing an iOS, Android, Flutter, or React Native release. If your app is already slow, crash-prone, or getting poor reviews, use the same checklist as a triage map: find the flow where users wait, measure it on real devices, fix the highest-impact bottleneck, and keep the evidence in your release notes.
For 2026 planning, treat mobile performance as a release governance issue. Android vitals now separates overall and per-device bad-behavior thresholds for user-perceived crashes, user-perceived ANRs, and battery signals; Google also documents that excessive partial wake locks can affect Play visibility from March 1, 2026. Apple performance guidance still pushes teams to reduce launch work, memory pressure, responsiveness issues, energy use, and terminations. A serious checklist should connect those platform signals to product flows, owners, and rollback criteria, not leave them as separate engineering dashboards.
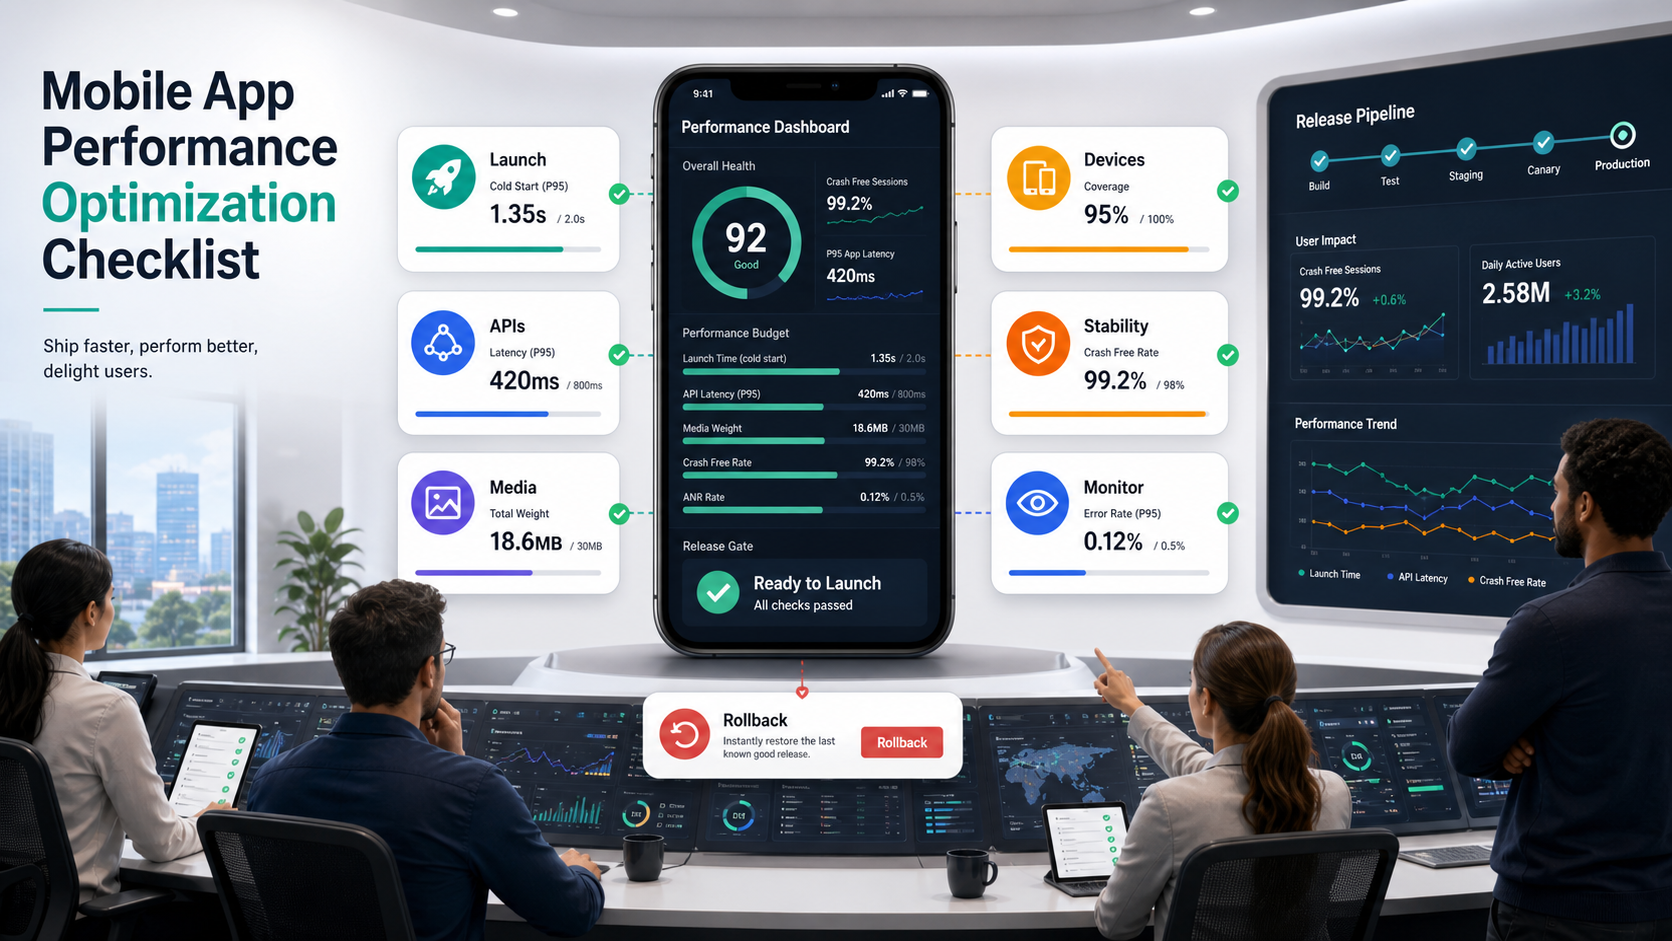
NextPage builds and improves mobile products where performance matters: commerce apps, field apps, internal workflow apps, healthcare tools, logistics surfaces, and consumer products with real usage spikes. For a build or rescue sprint, our mobile app development company team can audit the app, prioritize fixes, and turn the release gate into an engineering plan. If the budget discussion is still open, pair the checklist with NextPage's mobile app development cost guide so performance requirements are scoped before engineering estimates are locked.
Why Mobile Performance Work Fails
Performance work usually fails for one of four reasons. First, the team measures backend API latency but ignores the user-visible wait caused by startup, config fetches, image decoding, layout work, and chained requests. Second, testing happens on the newest developer devices instead of mid-range phones, low battery, weak networks, and old OS versions. Third, fixes are treated as isolated optimizations instead of release gates. Fourth, nobody owns post-launch monitoring, so the same issues return in the next release.
Apple's developer guidance emphasizes launch time, main-thread responsiveness, memory, energy, disk writes, and profiling with Xcode Organizer and Instruments. Android vitals focuses teams on user-perceived crash rate, user-perceived ANR rate, excessive wake locks, and other quality signals that can affect store visibility when they cross bad-behavior thresholds. Those platform signals are useful, but they need product context: which screen, app version, device class, network, user segment, and recent release caused the pain? For teams rebuilding brittle mobile surfaces, the same evidence belongs in a broader legacy software modernization plan and, for older enterprise apps, an enterprise mobile app modernization roadmap rather than an isolated optimization ticket.
| Checklist Area | What To Measure | Release Gate |
|---|---|---|
| Launch | Cold start, warm start, first interactive screen. | No critical flow should block on avoidable startup work. |
| Media | Image/video bytes, decode time, cache hit rate. | Heavy media must be resized, compressed, cached, or deferred. |
| APIs | Round trips, p95 latency, retries, payload size. | Primary flows must avoid serial calls and uncontrolled retries. |
| Device load | Memory, battery, CPU, render jank, thermal behavior. | Mid-range devices must remain stable during realistic sessions. |
| Release | Crash/ANR, slow transactions, reviews, support tickets. | Dashboards and rollback triggers must exist before launch. |
2026 Platform Signals To Watch Before Release
Performance gates should reflect what app stores and platform tooling now expose. Android vitals highlights user-perceived crash rate, user-perceived ANR rate, and excessive partial wake locks; Google Play notes that bad behavior on core vitals can affect discoverability, and the partial wake-lock metric began affecting Play visibility on March 1, 2026. Treat wake-lock evidence as a product risk, not a background-engineering detail: Android currently reports partial wake-lock use as excessive when non-exempted partial wake locks add up to 2 or more hours in a 24-hour period while the app is in the background or a foreground service, and Google describes the bad-behavior threshold as more than 5% of sessions over the last 28 days. For iOS, teams should keep using Xcode launch, responsiveness, memory, and energy tools because a fast API does not help if the app blocks the main thread or burns battery during common sessions.
Translate those platform signals into release evidence. Before shipping, record user-perceived crash rate, user-perceived ANR rate, startup traces, slow screens, battery or wake-lock risk, and the app version or device class affected. As of the current Android vitals documentation, the overall bad-behavior threshold is at least 1.09% of daily active users for user-perceived crashes and at least 0.47% for user-perceived ANRs, with an 8% per-device threshold for each signal. After shipping, segment the same dashboards by version, OS, device class, screen, endpoint, and user segment so the team can tell whether a regression is isolated or broad enough to trigger rollback.
Use exact platform language in the gate. Android vitals separates overall bad behavior from per-device bad behavior, so a small but important device cohort can still hurt quality even when the blended average looks acceptable. Firebase Performance Monitoring can then help the team filter traces by app version, device, country, or URL pattern; custom network traces are useful when a critical API client is not captured automatically, but they do not support custom metrics the way custom code traces do. That connects the regression to a release, screen, or backend dependency before the rollback window closes.
1. Define Performance Budgets By User Flow
Start with flows users actually care about: app launch, login, search, product detail, cart, checkout, booking, upload, dashboard load, notification open, and offline sync. Averages hide pain. Set budgets at p75 and p95 where possible, then split each wait into client work, network work, backend work, render work, and media work.
For example, an API may respond in 220 ms, but the user still sees a 2.5 second blank state because the app waits for remote config, profile, recommendations, and images before drawing anything. The checklist should ask whether the screen can render a useful shell earlier, prefetch only what matters, cache the previous state, or defer secondary calls.
- List the top five revenue, retention, or operational flows.
- Measure each flow on at least one high-end and one mid-range device.
- Capture cold start, warm start, tap-to-feedback, first useful content, and full completion time.
- Mark whether delay comes from client code, API, media, storage, rendering, background jobs, or third-party SDKs.
- Assign a release owner, evidence source, and rollback trigger for every failed budget.
Mobile Performance Budget Matrix By User Flow
A useful budget matrix ties every threshold to the flow a user is trying to complete. Launch, login, search, checkout, upload, and offline sync deserve different budgets because they carry different product risk, technical constraints, and owner responsibilities. Treat each flow as a contract between product, mobile, backend, QA, and operations.
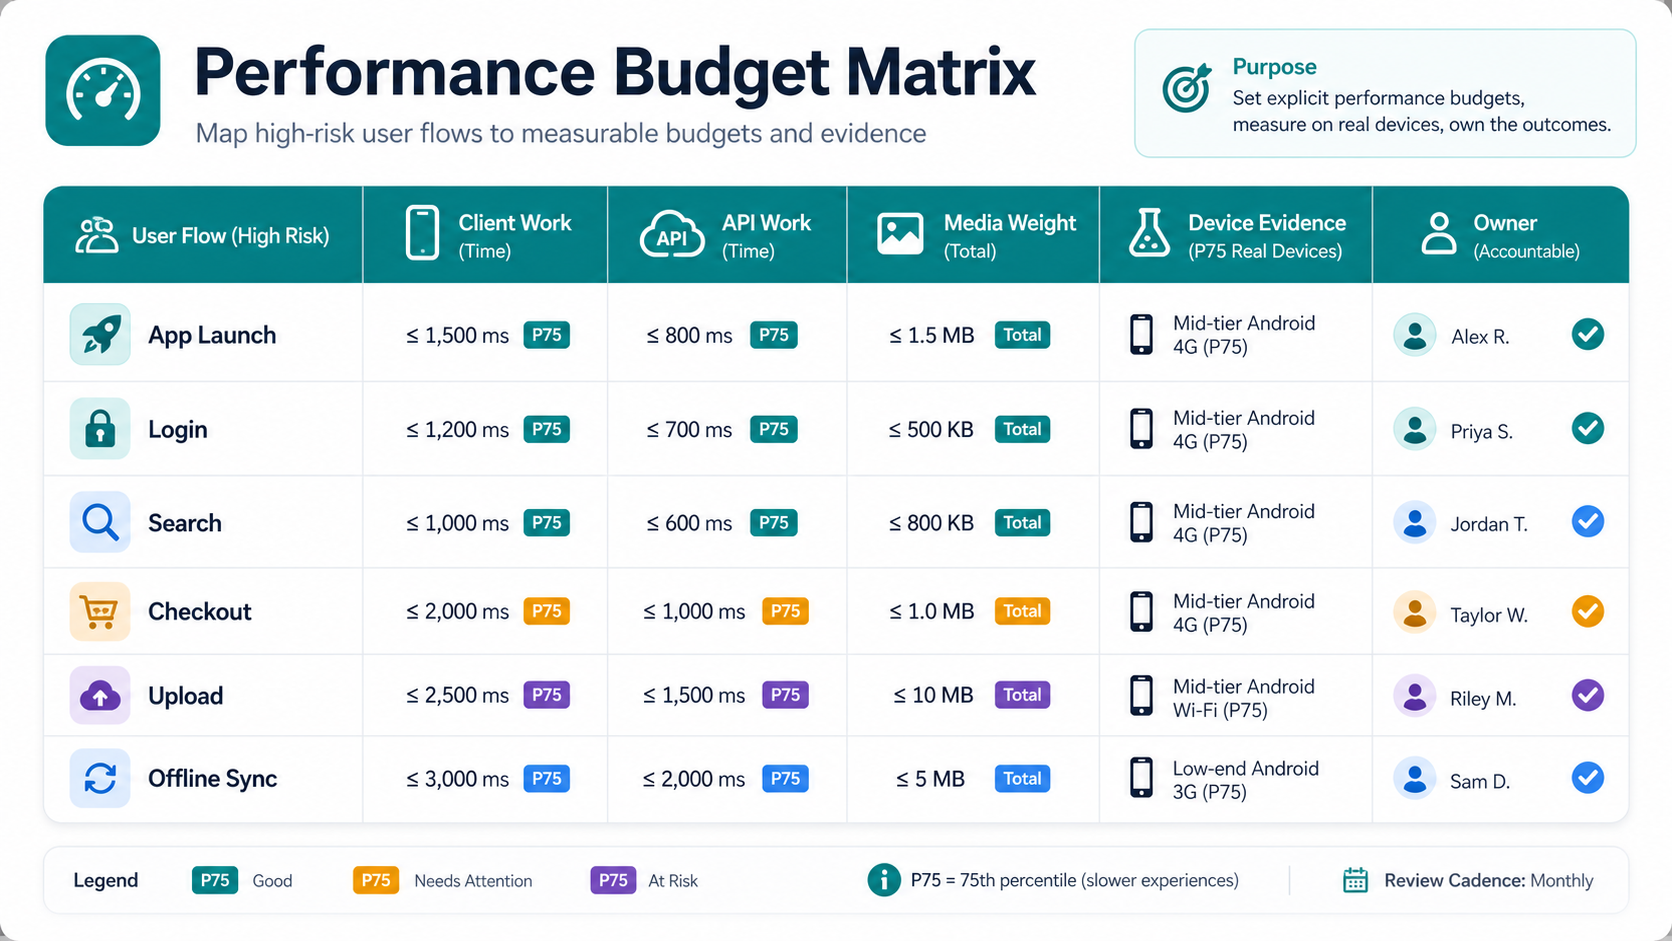
The matrix is also a scope-control tool. If checkout fails its latency budget because the app waits on too many services, the fix may involve API aggregation, caching, or backend workflow changes. Teams can use the MVP scope builder to protect first-release flows from nonessential scope, then use the custom software cost estimator when performance work becomes backend, cloud, or integration remediation.
2. Optimize Launch Speed Before Adding More Features
Launch speed is the user's first performance signal. Move avoidable work out of startup: analytics batching, large dependency initialization, nonessential SDK setup, expensive database reads, oversized assets, and network calls that do not need to block the first usable screen. On iOS, keep the main thread available to draw the first frame. On Android, watch startup paths that inflate heavy layouts, initialize too many services, or block on disk and network.
Use platform tools, not guesswork. Xcode Instruments and Organizer help identify launch, responsiveness, memory, and energy issues. Android Studio Profiler, Android vitals, Firebase Performance Monitoring, Sentry, Datadog RUM, New Relic Mobile, and similar tools can help connect slow screens to releases and device classes.
If the app is a legacy hybrid or plugin-heavy build, launch problems may be structural. Use the legacy hybrid mobile app modernization guide to decide whether to tune, migrate, or rebuild the slowest parts rather than chasing symptoms indefinitely. Native Android teams should also compare launch and Play Console evidence with the Android app development cost drivers before turning a performance sprint into a larger platform roadmap.
3. Reduce Media Weight Without Hurting UX
Media is often the easiest visible win. Resize images to the displayed dimensions, compress at sensible quality levels, use modern formats where platform support is reliable, cache aggressively, and avoid decoding huge assets on the main thread. Video needs the same discipline: adaptive bitrate, thumbnails, lazy loading, and clear rules for autoplay, preloading, and offline storage.
Do not optimize media only in the CMS or only in the app. The release gate should cover the whole pipeline: design export, upload processing, CDN transformation, app cache, decode path, placeholder behavior, and failure state. A 4 MB hero image is still a performance bug if the app downloads it on every product detail screen. The same principle applies to web-backed mobile products, where an eCommerce cloud performance optimization plan may need CDN, API, database, and frontend improvements together.
| Media Check | Question | Evidence |
|---|---|---|
| Dimensions | Is the app downloading pixels it never displays? | Network waterfall and rendered dimensions. |
| Compression | Are photos, illustrations, and thumbnails using suitable formats? | Before/after byte size and visual QA. |
| Caching | Do repeated sessions avoid re-downloading stable assets? | Cache headers, app cache logs, repeat-load test. |
| Decode | Can image decode block scroll or the first frame? | Profiler trace and jank report. |
4. Fix API Latency Where Users Feel It
API optimization starts with the user-visible path. Count how many network calls a screen makes, which calls are serial, which are duplicated, which payloads are too large, and which retries happen silently. A good performance gate does not say "API p95 under 500 ms" in isolation. It says "search results show useful feedback within the budget on a mid-range device and degraded network."
Use pagination, partial responses, server-side aggregation, request coalescing, and cacheable endpoints where they fit. Avoid making mobile clients stitch together five endpoints before showing one screen. For unstable networks, design explicit states: cached content, retry, offline queue, conflict resolution, and user-facing error copy.
For unstable networks, connect API work to a broader mobile app integrations checklist so authentication, retries, analytics, webhooks, payments, support tools, and offline queues are tested as one user-visible flow. If the issue is an inherited Cordova, PhoneGap, or plugin-heavy app, compare performance fixes with PhoneGap and Cordova app migration services before investing in short-lived patches.
5. Test On Real Devices, Networks, And App States
Simulators are useful, but performance release gates need real devices. Test low-memory devices, older supported OS versions, spotty Wi-Fi, mobile data, low battery, background/foreground transitions, permission denial, app upgrades, expired sessions, and large local datasets. Include at least one long session, because memory leaks and battery drain often appear after repeated navigation.
The mobile app testing checklist covers broader device and workflow coverage, while NextPage's software QA testing services can help teams turn traces, screenshots, crash clusters, and device matrices into release evidence. For release readiness, pair it with the mobile app QA and launch checklist so performance evidence sits next to store readiness, analytics, crash reporting, rollback planning, and support ownership.
- Run the same scenario on high-end, mid-range, and low-end supported devices.
- Throttle network conditions and test retries, offline recovery, and timeout copy.
- Record memory growth across repeated navigation loops.
- Check battery and wake-lock behavior for background tasks.
- Keep screenshots, traces, and dashboard links as release evidence.
Security And Performance Should Share A Release Gate
Mobile performance work often touches authentication, API retries, offline storage, permissions, analytics SDKs, crash reporters, and cached data. Treat those changes as security-adjacent, not just speed work. A faster login flow should still protect session state; an offline queue should still handle sensitive records correctly; a monitoring SDK should not collect more user data than the product needs.
For regulated or sensitive apps, pair the performance checklist with a mobile app security hardening review. That keeps threat modeling, API exposure, local storage, privacy controls, and release evidence aligned instead of creating one fast app and a separate security backlog.
6. Set Performance Release Gates
A checklist becomes useful when it can block a release. Define gates for launch, primary transaction latency, crash-free sessions, ANR or hang signals, memory growth, battery drain, wake-lock risk, media payloads, and slow-screen alerts. The exact threshold depends on your product, device base, and risk profile, but every threshold should have an owner, a measurement method, a stored evidence link, and a named rollback decision maker. If a gate cannot be measured by version and device class, it is not ready to decide a production release.
| Gate | Owner | Typical Evidence | Blocker Example |
|---|---|---|---|
| Startup | Mobile lead | Profiler trace, device matrix. | Cold start blocks on nonessential SDKs. |
| Primary flow latency | Mobile + backend | RUM trace, API logs, screen timing. | Checkout waits on serial calls before rendering. |
| Stability | QA + release owner | Crash/ANR dashboard by version. | New release increases user-perceived crashes. |
| Media payload | Product + frontend/mobile | Network waterfall and asset report. | Hero or feed images exceed agreed budgets. |
| Monitoring | Engineering manager | Dashboards, alerts, rollback plan. | No owner can see slow screens after launch. |
If you need an external QA layer, NextPage's mobile app testing services can add device matrix testing, performance scenarios, API handoff checks, automation coverage, and release evidence without waiting until the last sprint.
Release Gates Scorecard And Monitoring Plan
The release scorecard should connect pre-launch QA to post-launch reliability. For each gate, record the owner, evidence artifact, pass/watch/block status, and rollback trigger. Startup, latency, media payload, stability, battery, monitoring, and rollback should be reviewed together because a release can pass one metric while still failing the user journey.
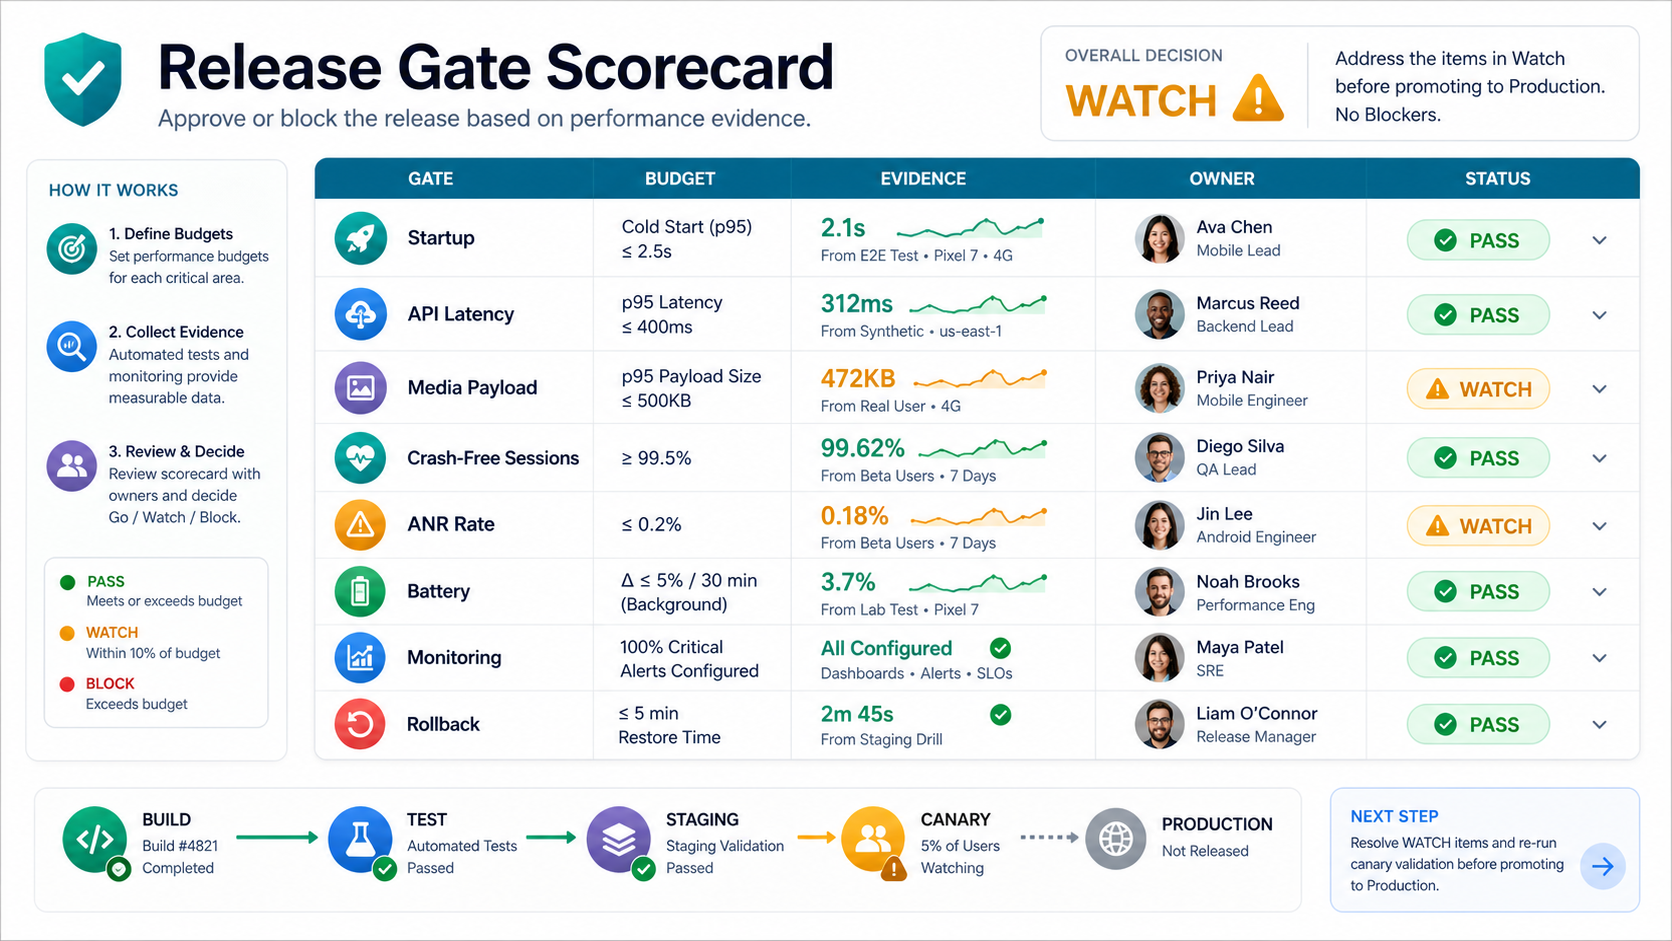
After release, keep the same scorecard alive in monitoring. Segment dashboards by version, device class, OS, geography, screen, endpoint, and user segment. For operational apps, add business-flow indicators such as failed bookings, delayed uploads, checkout drop-off, missed dispatches, or support tickets. The custom dashboard development services team can help combine app telemetry, backend metrics, and support signals when off-the-shelf dashboards do not match the product workflow.
7. Monitor After Launch And Triage By Impact
Performance work does not end at release. Monitor by app version, device model, OS, geography, screen, user segment, and recent deploy. Connect crash and latency signals with review text and support tickets. A slow flow used by 70 percent of customers matters more than a rare trace in a low-traffic admin screen.
Post-launch triage should ask four questions: how many users are affected, which business flow is degraded, whether the issue is tied to a specific release, device, endpoint, or content payload, and whether the same issue belongs in the mobile app maintenance checklist for recurring ownership. That framing helps teams avoid random optimization and focus on fixes that protect retention, revenue, and support load. For field, logistics, or route-heavy products, the ClearRoute portfolio case study shows why performance evidence must connect capture, processing, review, and operations instead of stopping at mobile traces.
Mobile App Performance Optimization Checklist
- Define performance budgets for the top five user flows.
- Measure cold start, warm start, hot start, tap-to-feedback, first usable screen, and completion time.
- Move nonessential SDKs, analytics, and network work out of startup.
- Resize, compress, cache, and defer media assets.
- Reduce serial API calls, retries, and oversized payloads.
- Test on real devices, weak networks, low battery, and older OS versions.
- Profile memory, CPU, render jank, battery, background work, and wake-lock behavior.
- Instrument critical API paths with automatic or custom network traces when default monitoring misses them.
- Set release gates for user-perceived crashes, user-perceived ANRs, wake-lock risk, latency, media weight, monitoring, and rollback.
- Prepare dashboards by version, device, screen, endpoint, geography, and cohort.
- Assign owners for remediation, rollback, and post-launch triage.
How NextPage Helps With Mobile App Performance
NextPage helps teams diagnose and fix slow mobile apps before launch or after production issues appear through mobile app testing services, mobile engineering, backend remediation, and monitoring support. We can audit your app flows, measure startup and screen latency, review media and API behavior, profile device performance, strengthen QA coverage, and create release gates your team can keep using.
The output should be practical: a ranked issue list, evidence from real devices, fixes split by quick wins and structural work, monitoring requirements, and a roadmap for performance-sensitive features. If your app needs both engineering and QA support, NextPage can provide a focused performance review or a broader mobile delivery pod.