
Quick Answer: Customer Sentiment Analytics
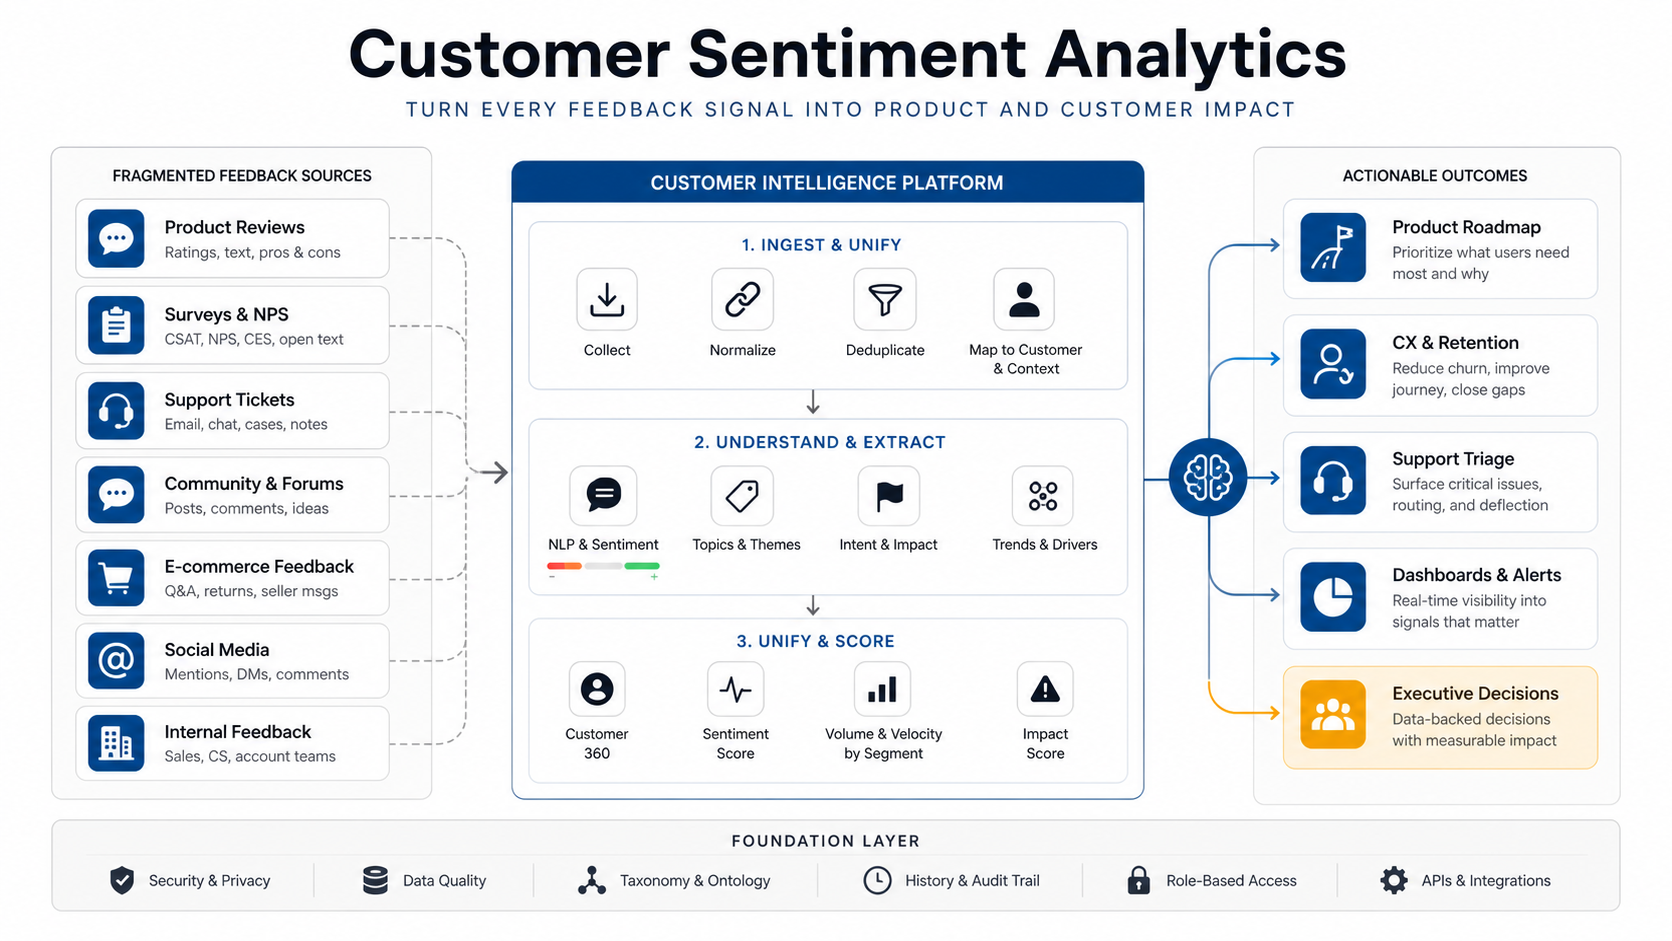
Customer sentiment analytics turns unstructured feedback from reviews, surveys, support tickets, chats, sales notes, app-store comments, and social channels into decision-ready product and customer signals. A useful system does more than label comments as positive, negative, or neutral. It connects sentiment with topics, urgency, customer segment, product area, churn risk, evidence, owner, confidence, and workflow status so product, CX, support, and growth teams can decide what to fix, prioritize, test, or escalate.
The practical roadmap starts with source data and taxonomy design, then adds NLP models, quality checks, dashboards, alert routing, and human review. Teams get the most value when sentiment analytics is tied to operating decisions: what product issue is growing, which customers need attention, what release caused complaint volume, which roadmap item has evidence, and where support is seeing repeated friction.
If the goal is a production AI system, treat sentiment analytics as workflow software, not a standalone model demo. NextPage's AI development services and AI automation services focus on the data, integrations, evaluation, monitoring, and review controls needed to make AI useful inside real product and customer operations.
Why Feedback Volume Breaks Product Decisions
Most teams already collect more feedback than they can read. Product managers scan win-loss notes and feature requests. Support teams tag tickets in the helpdesk. CX teams review surveys and NPS comments. Marketing watches social comments and public reviews. Sales hears objections before a deal closes. Each channel has partial truth, but the signals are scattered.
That fragmentation creates familiar problems. A loud account can outweigh a broad pattern. Support tags drift across agents. Product teams see the same issue under five different names. Survey comments reveal frustration but do not show which product area caused it. Reviews describe a pain point, but no one connects it to backlog items or churn risk. Manual review works for dozens of comments. It fails when feedback arrives every day across thousands of records.
| Problem | What Usually Happens | What Sentiment Analytics Should Add |
|---|---|---|
| Feedback overload | Teams sample comments manually and miss patterns | Topic clustering, sentiment trend lines, and representative evidence |
| Inconsistent tagging | Agents and teams use different labels | A shared taxonomy with confidence scores and human correction |
| Weak roadmap evidence | Feature requests are prioritized by anecdotes | Segment, revenue, severity, volume, and recency signals |
| Slow escalation | Urgent tickets wait in the same queue as routine issues | Urgency, churn-risk, sentiment-drop, and owner-routing rules |
| Dashboard noise | Charts show sentiment but not what to do next | Decision views for product, support, CX, growth, and leadership |
Customer Feedback Sources to Connect First
Start with the channels that already affect decisions. A sentiment system does not need every possible source on day one. It needs enough coverage to show patterns that manual review cannot reliably detect.
- Support tickets: issue category, urgency, sentiment, escalation risk, affected feature, customer tier, agent notes, and resolution outcome.
- Surveys and NPS comments: open-ended reasons, product expectations, onboarding blockers, pricing objections, and loyalty signals.
- Public reviews: app-store, marketplace, G2, Capterra, Google, Trustpilot, or industry-specific reviews with star rating and competitor context.
- Chat and call summaries: recurring objections, bug reports, usability friction, cancellation reasons, and handoff notes.
- Product feedback forms: feature requests, usability complaints, enhancement ideas, beta feedback, and internal votes.
- Sales and customer success notes: deal blockers, renewal risks, onboarding friction, expansion signals, and competitive mentions.
- Social and community comments: launch reactions, bug spikes, feature sentiment, brand perception, and emerging language customers use.
The system should preserve source context. A one-star app review, a survey comment from an enterprise customer, and a support ticket from a churn-risk account should not be treated as identical text records. Source, customer segment, product version, plan, region, account state, language, and permission boundaries all change how the signal should be interpreted.
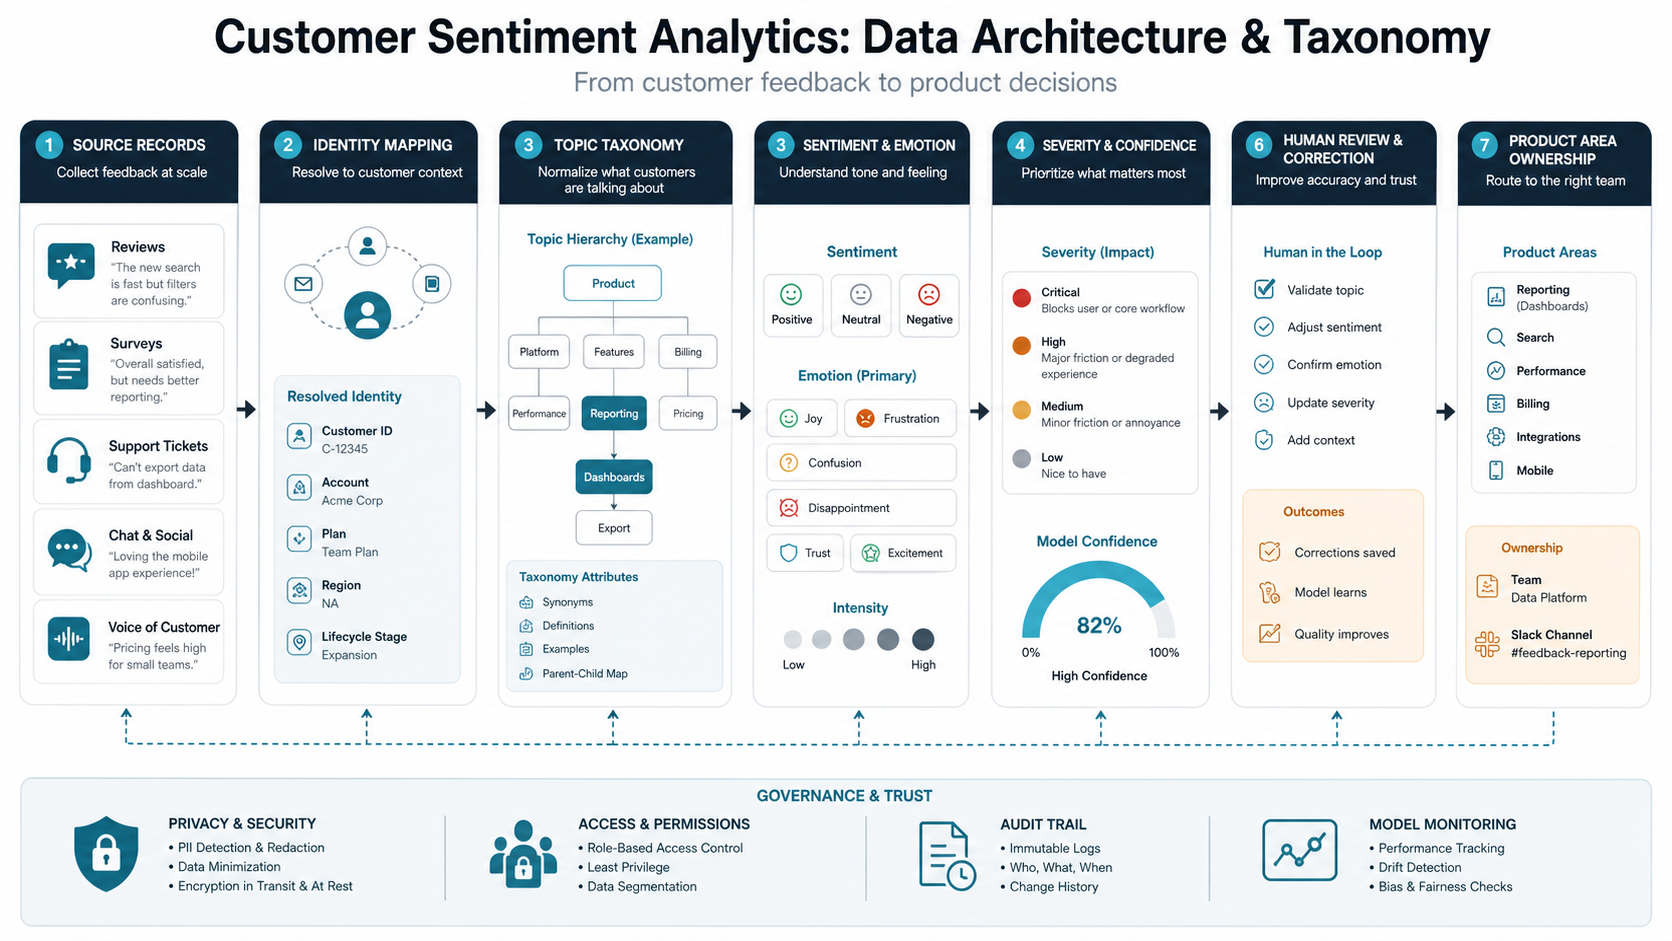
Design the Taxonomy Before Choosing Models
Model choice matters, but taxonomy design matters first. A taxonomy defines the product areas, issue types, emotion labels, priority levels, journey stages, and ownership rules the business will use. Without it, the analytics system may produce attractive clusters that no team knows how to act on.
Useful taxonomy layers include:
- Product area: onboarding, billing, checkout, search, notifications, admin, integrations, reporting, mobile app, API, or support experience.
- Issue type: bug, missing feature, confusing UX, performance, reliability, pricing, documentation, training, or service complaint.
- Sentiment and emotion: positive, neutral, negative, frustrated, confused, urgent, delighted, anxious, or disappointed.
- Severity: blocker, high friction, repeated complaint, improvement request, low-impact comment, or unclear.
- Business context: customer tier, renewal window, revenue band, market segment, product version, geography, and channel.
- Routing owner: product manager, support lead, engineering team, CX owner, marketing, sales, or executive escalation.
Keep the first taxonomy small enough for people to review. A good MVP may start with 8 to 12 product themes, 5 to 8 issue types, and a clear severity model. Teams can add nuance after they see where the model is confused and which labels actually change decisions. If the taxonomy will feed production classifiers, pair the roadmap with an NLP implementation roadmap so data audit, evaluation, monitoring, and workflow ownership are designed together.
Reference Architecture for Sentiment Analytics
A production sentiment platform has four layers: ingestion, processing, decision logic, and activation. Each layer should be observable and correctable. The goal is not to automate judgment completely; it is to make the right evidence visible earlier.
| Layer | Build Focus | Design Notes |
|---|---|---|
| Ingestion | Connect helpdesk, surveys, reviews, CRM, product feedback, chat, and data warehouse sources | Normalize IDs, timestamps, customer context, product version, and source metadata |
| Processing | Clean text, remove duplicates, classify topics, score sentiment, detect urgency, extract entities | Store confidence, model version, language, and human corrections |
| Decision logic | Aggregate themes, trend changes, segment impact, severity, routing, and thresholds | Use rules where precision matters and AI where language variation matters |
| Activation | Dashboards, alerts, backlog evidence, support queues, CRM notes, and leadership reports | Send each team only the signals they can act on |
For teams with helpdesk automation already underway, connect sentiment analytics to existing support context rather than building a separate reporting island. The related guide on AI customer service agent integration covers how CRM, helpdesk, knowledge base, analytics, escalation, and governance fit together. Production language systems also need ongoing quality checks; NextPage's NLP model monitoring and MLOps services are relevant when labels, prompts, or classifiers can drift after launch.
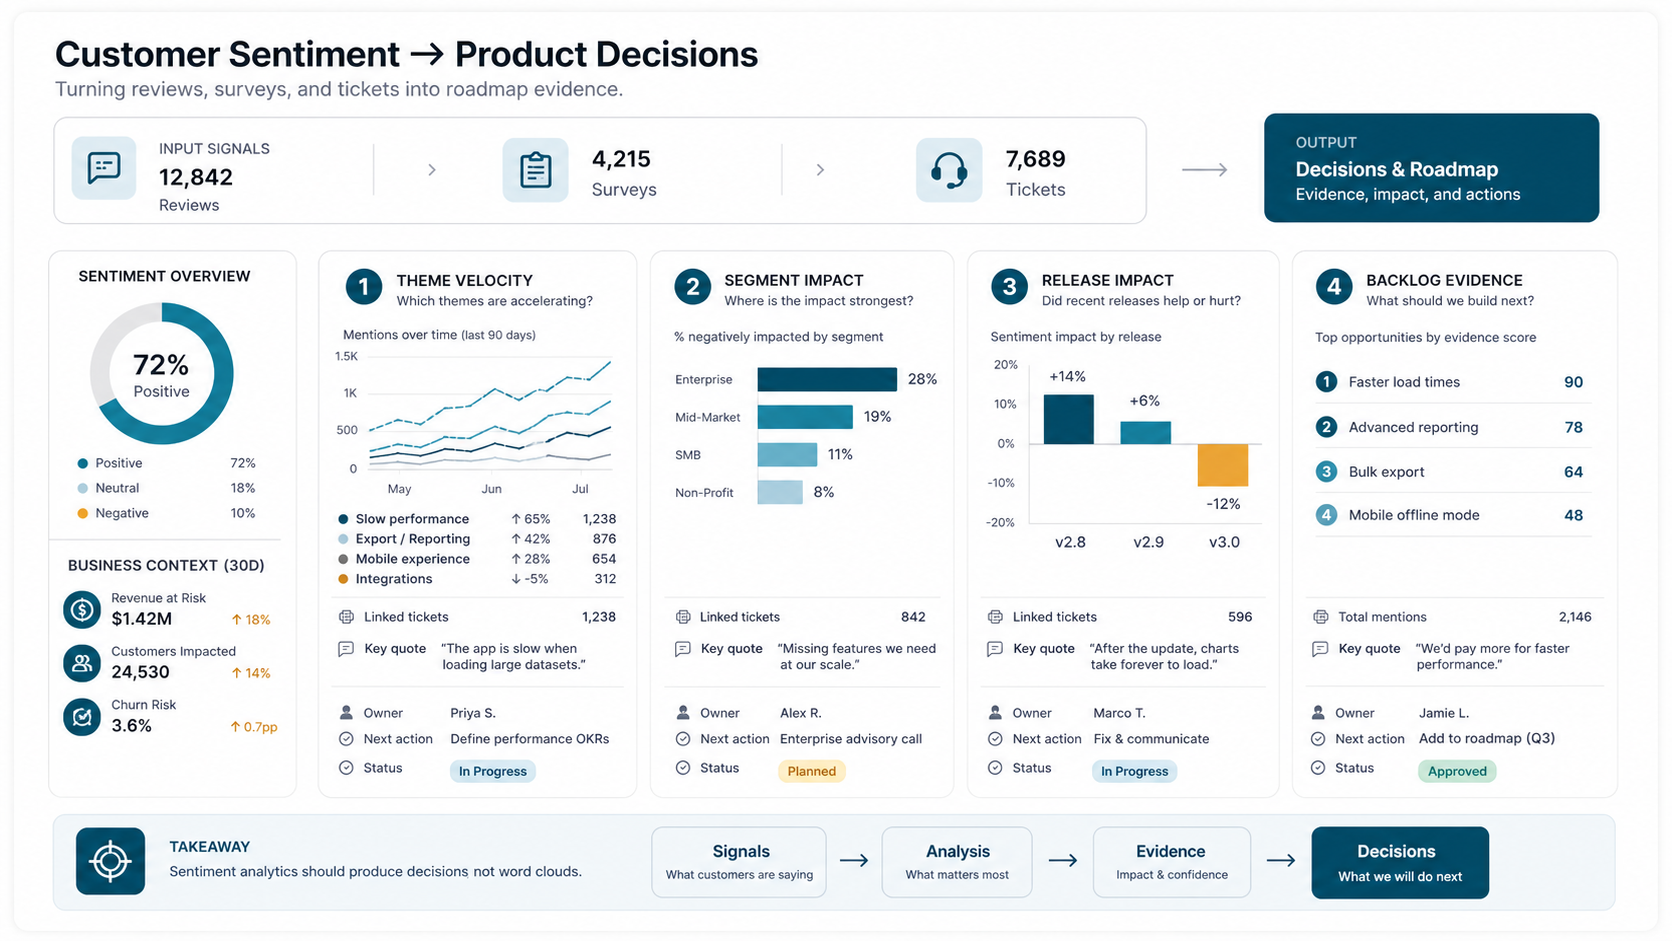
Turning Sentiment Into Product Roadmap Decisions
Customer sentiment analytics becomes valuable when it changes roadmap conversations. Instead of saying "users are unhappy with onboarding," the product team should see which onboarding step creates friction, which segments mention it, whether sentiment worsened after a release, how many tickets are linked, what revenue or churn risk is attached, and which comments best illustrate the problem.
Design product views around decision questions:
- Which themes are increasing faster than normal?
- Which negative themes affect high-value or high-retention-risk customers?
- Which feature requests appear across reviews, tickets, surveys, and sales notes?
- Which release or experiment created a sentiment change?
- Which backlog items have enough customer evidence to prioritize?
- Which complaints are actually documentation, onboarding, or service issues instead of product gaps?
The output should not be a giant word cloud. It should be a product evidence board: theme, volume, sentiment, severity, affected segment, sample comments, linked tickets, customer impact, likely owner, recommended next action, and status. For many teams, that means a purpose-built custom dashboard development path rather than a passive report.
Support, CX, and Retention Workflows
Support and CX teams need sentiment analytics at the record level and the trend level. Record-level scoring helps route urgent issues, identify angry or confused customers, and escalate churn-risk conversations. Trend-level analysis helps leaders fix the root causes that create repeated tickets.
A useful workflow may route billing anger to a specialist queue, send repeated integration complaints to the product owner, create an alert when enterprise-account sentiment drops, or summarize the top friction themes for weekly product review. This is where sentiment analytics overlaps with AI workflow automation: models classify language, rules apply business context, and humans approve sensitive actions. If the workflow will change support queues or customer responses, scope it alongside AI customer service agent development rather than treating sentiment as a reporting-only feature.
Do not over-automate early. A strong first version recommends owners, labels, and severity. Human reviewers correct the model, tune thresholds, and decide which actions are safe to automate later.
Dashboards and Alerts That Teams Actually Use
The dashboard should match operating roles. Product needs product-area trends, roadmap evidence, release impact, and representative comments. Support needs queue risk, urgency, and repeat issues. CX needs account health, churn-risk themes, and renewal blockers. Leadership needs a compact view of product friction, customer sentiment, response time, and the actions underway.
The build decision matters. A BI report may be enough when the system is mostly historical analysis. A custom dashboard is better when users need workflow actions, embedded review queues, alerts, role-based views, annotations, and write-back to product or support systems. The Power BI vs custom dashboard app comparison is a useful planning lens for this decision, and NextPage's Power BI consulting services can help when the first version should stay inside a governed BI stack.
| View | Primary User | Decision It Supports |
|---|---|---|
| Theme trend board | Product managers | Which issues deserve roadmap attention this sprint or quarter? |
| Urgency queue | Support leads | Which tickets or customers need faster human response? |
| Segment sentiment | CX and growth teams | Which customer groups are improving or deteriorating? |
| Release impact | Product and engineering | Did a release create new complaints or resolve old ones? |
| Executive scorecard | Leadership | What changed, why it matters, and what team owns the response? |
Build Vs Buy: Sentiment Tool, BI Dashboard, Or Custom Workflow?
Buy or configure a sentiment tool when the goal is broad listening, survey reporting, review monitoring, or simple channel-level trends. Many teams can start there if they only need positive/negative trends and manual follow-up.
Use BI when the main job is trusted reporting across known sources, stable KPIs, and recurring leadership views. A BI path works well when users do not need to change records, route tickets, assign owners, or review model outputs inside the same experience.
Build a custom workflow when sentiment analytics needs to connect private data, customer segments, product areas, backlog items, CRM state, support queues, approval steps, audit evidence, and write-back actions. That is especially common for SaaS, ecommerce, marketplaces, and support-heavy businesses where feedback intelligence becomes part of the operating system. If CRM ownership and service handoffs are central, pair the build with CRM integration and workflow automation services.
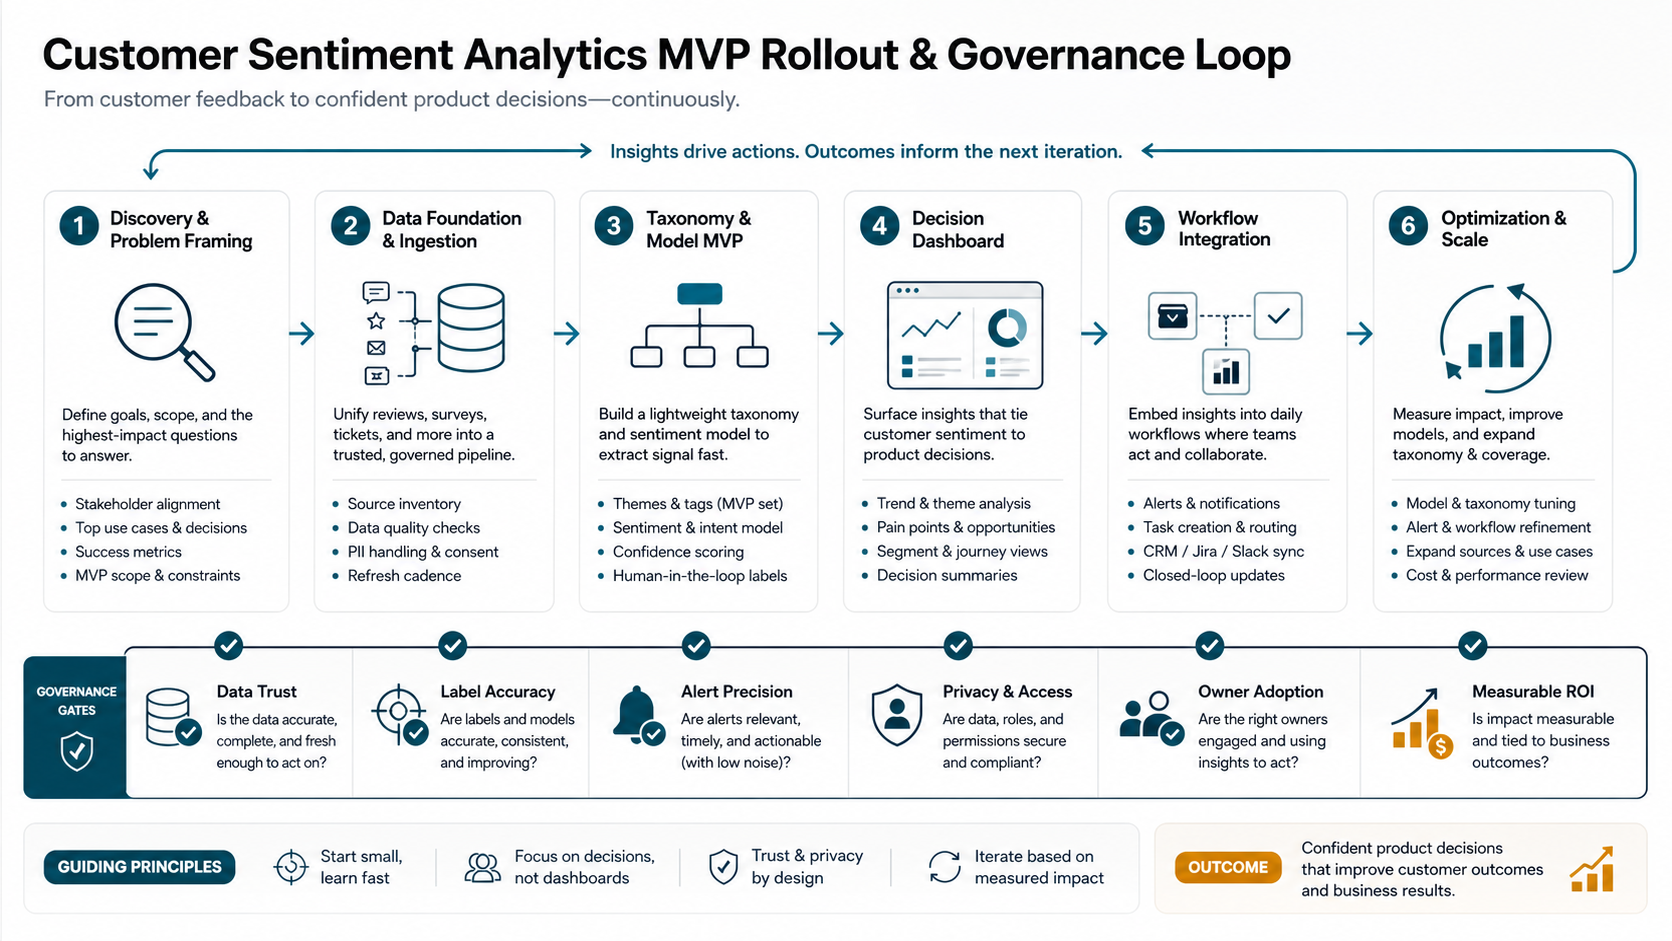
MVP Roadmap for a Feedback Intelligence Platform
A practical MVP should prove that feedback analytics changes decisions before the team invests in broad automation. Start with one or two high-volume sources and one decision loop, such as support-ticket triage plus weekly product theme review.
| Stage | Build Focus | Validation Question |
|---|---|---|
| Discovery | Map sources, users, taxonomy, current reporting, and decision rituals | Which feedback decisions are slow, biased, or invisible today? |
| Data foundation | Connect priority sources and normalize customer, product, source, and timestamp context | Can the team trust the data enough to review it weekly? |
| Model and rules MVP | Classify topics, sentiment, urgency, product area, and owner with confidence scores | Are the labels accurate enough to guide human review? |
| Decision dashboard | Create role-based views, trend detection, representative evidence, and review queues | Does the dashboard help teams make faster product and CX decisions? |
| Workflow integration | Write back labels, alerts, backlog evidence, CRM notes, and support routing outcomes | Can the workflow run without duplicate data entry? |
| Optimization | Tune thresholds, add more sources, improve evaluation, and automate safe actions | Which automation improves response speed or roadmap evidence quality? |
Budgeting should include data cleanup, integrations, model evaluation, dashboard design, security, and post-launch tuning. Screen count alone will understate the work. The custom software development cost drivers are especially relevant when the platform needs multiple APIs, AI features, role-based workflows, and reporting.
KPIs for Customer Sentiment Analytics
Measure whether the system improves decisions, not just whether it labels text. Useful KPIs connect analytics quality with operational outcomes.
- Tagged feedback coverage: the share of usable feedback classified by source, product area, and issue type.
- Human correction rate: how often reviewers change model labels, owners, severity, or sentiment.
- Theme detection speed: how quickly a repeated issue becomes visible after volume starts rising.
- Alert precision: the share of alerts that lead to a real action rather than noise.
- Roadmap evidence quality: how many prioritized items include customer quotes, segments, volume, severity, and linked records.
- Escalation response time: how quickly urgent or churn-risk feedback reaches the right owner.
- Time-to-decision: how long it takes product or CX teams to move from feedback signal to next action.
- Automation value: estimated analyst, support, or product-ops time saved from triage and reporting.
For directional business-case planning, teams can use the AI automation ROI calculator to estimate saved hours and payback before scoping a full build. Support teams can also compare deflection, escalation, CSAT, and human-review assumptions with the AI customer support automation ROI guide.
Common Risks and Controls
Customer sentiment analytics touches customer records, brand reputation, roadmap prioritization, and support routing. Treat the risk controls as part of the product, not as an afterthought.
- Bad taxonomy: start small, review examples with product and support teams, and rename labels when users misunderstand them.
- Over-trusting sentiment scores: combine sentiment with topic, severity, customer context, and human review.
- Duplicate feedback: detect repeated tickets, copied reviews, campaign spikes, and merged accounts so volume is not inflated.
- Low-context alerts: include the why, evidence, owner, suggested action, and confidence level with every alert.
- Privacy and access: restrict sensitive customer records, redact where needed, and audit who can view or export feedback.
- Channel bias: show which source each trend came from so app-store complaints do not masquerade as whole-customer sentiment.
- Model drift: monitor corrections, new product terms, release changes, language variation, and stale labels over time.
Next Steps for Product and CX Teams
Start by choosing one decision loop. For example: turn support tickets and survey comments into a weekly product evidence board, or route urgent churn-risk comments from enterprise accounts to CX owners. Define the sources, taxonomy, owners, review cadence, and success metrics before building the first dashboard.
NextPage can help scope a customer feedback intelligence dashboard that connects your reviews, surveys, tickets, and CRM context into product and CX decisions. The useful first step is a discovery call to map your feedback sources, taxonomy, operating workflows, data permissions, model evaluation plan, and first MVP release. If you need a directional estimate before discovery, start with the Custom Software Cost Estimator and use the result as a conversation starter, not a final quote.