
Quick Answer: Renewable Energy Software Development Cost
Renewable energy software development cost usually starts around $45,000 to $90,000 for a focused MVP, moves into the $100,000 to $250,000 range for an integrated EMS or asset monitoring platform, and can exceed $300,000 to $700,000+ when the product must coordinate SCADA data, IoT devices, forecasting models, grid reporting, storage assets, role-based operations, and high-availability infrastructure.
The real cost driver is not whether the software serves solar, wind, hydro, storage, or mixed assets. It is how many live operational systems the platform must trust. A simple dashboard that imports meter readings is a different project from a command center that ingests historian data, predicts production, alerts field teams, reconciles maintenance work, and gives finance or compliance teams auditable reports.
If you are budgeting a renewable energy platform, start with the operating decision the software must improve. Do you need faster fault detection, better production forecasting, lower curtailment, safer maintenance, investor reporting, battery dispatch visibility, or a new digital product for customers? Once that decision is clear, use a planning tool like the Custom Software Cost Estimator to model the feature set, integration depth, and risk level before you request vendor quotes. If the first release is still too broad, use the MVP Scope Builder to separate must-have operating workflows from later optimization features.
Renewable Energy Software Cost Ranges
Cost ranges are broad because renewable energy software can mean anything from a mobile field app to an enterprise energy management system. The table below gives a practical starting point for scope conversations.
| Software Scope | Typical Budget Range | Best Fit | Main Cost Drivers |
|---|---|---|---|
| Planning or reporting MVP | $45,000-$90,000 | Early product validation, investor reporting, simple operator dashboards | Dashboard UX, manual imports, limited workflows, basic role access |
| Single-site monitoring platform | $80,000-$160,000 | Solar plant, wind site, battery pilot, or microgrid operations | Meter or inverter data, alerts, asset hierarchy, time-series storage, uptime requirements |
| Integrated EMS or APM platform | $150,000-$350,000 | Multi-site operators and utilities that need workflows across assets | SCADA or historian integration, maintenance systems, forecasting, permissions, reporting |
| Enterprise renewable operations platform | $300,000-$700,000+ | Utilities, IPPs, aggregators, and DER platform teams | High availability, cyber controls, grid data, storage dispatch, AI models, audit trails, scale |
These numbers should be treated as planning bands, not fixed quotes. A small product can become expensive if it needs difficult device integrations or strict uptime guarantees. A larger platform can stay controlled if the MVP avoids automated control logic, starts with read-only monitoring, and proves value before expanding into dispatch or optimization.
Grid Interconnection And DER Readiness Costs
In 2026, renewable energy software estimates should include grid-readiness work earlier than many teams expect. The International Energy Agency's 2026 electricity outlook expects variable renewable energy from solar PV and wind to rise sharply through 2030, and its Renewables 2025 tracker shows the scale of new capacity being planned. More variable generation means the software around a renewable portfolio must do more than show production charts; it must help teams prove data quality, manage interconnection evidence, coordinate storage behavior, and explain operating limits.
For US-connected projects, FERC Order No. 2023 is a useful planning signal because interconnection reform emphasizes cluster studies, queue readiness, modeling standards, storage charging assumptions, and inverter-based resource performance. Even when a project is outside the United States, the same software question appears: can the platform produce the telemetry, documents, model assumptions, and audit trail needed for grid-facing decisions?
| Grid-Readiness Driver | Software Scope To Budget | Why It Changes Cost |
|---|---|---|
| Interconnection evidence | Asset registry, one-line references, study artifacts, site status, submission dates, and document version history. | Requires workflow, permissions, audit logs, and structured records instead of a simple dashboard. |
| Inverter and storage modeling | Operating limits, charging assumptions, site constraints, equipment metadata, and reviewed changes. | Pushes the platform toward configuration governance and engineering review paths. |
| Telemetry quality | Freshness checks, missing-data flags, unit normalization, source labels, and confidence indicators. | Data engineering and observability become part of MVP scope when decisions depend on live signals. |
| Curtailment and dispatch visibility | Event logs, forecast comparisons, dispatch notes, override reasons, and revenue impact views. | Adds workflow and analytics depth beyond normal production reporting. |
| DER cybersecurity | Identity, access control, vendor access, secure secrets, segmentation notes, vulnerability workflows, and incident evidence. | DOE DER-CF and NIST smart-grid guidance point to system-wide risk management, not one-time application hardening. |
This does not mean every renewable EMS MVP needs full grid-operations automation. It means the estimate should name which grid-facing obligations are in scope now, which are handled manually, and which become later release gates. If the first release focuses on reporting, keep interconnection and DER security as structured records. If the platform will support dispatch recommendations or storage operations, budget for stronger architecture, testing, and operational review from the start.
FERC's June 2026 grid-efficiency actions are another reminder that software estimates should include evidence quality, study data, operating constraints, and reliability reporting as first-class scope. Those artifacts are rarely glamorous features, but they are what make renewable operating software useful when a portfolio must coordinate new generation, storage, grid requests, and stakeholder reporting under tighter timelines.
What Drives Renewable Energy Software Cost?
Renewable energy software sits between field hardware, operational teams, commercial stakeholders, and grid constraints. That makes the budget more sensitive to integration and reliability than a normal business dashboard.
Data acquisition is often the first major driver. Solar inverters, wind turbines, meters, weather feeds, battery systems, gateways, and SCADA historians may expose data through different protocols, refresh rates, naming conventions, and reliability patterns. Normalizing that data into one asset model takes discovery and careful engineering.
Operational workflows add the next layer. Fault triage, field work orders, curtailment notes, maintenance windows, incident history, and investor reporting all require different screens and permissions. If the platform only visualizes data, cost is lower. If it must coordinate action across operators, technicians, managers, and external stakeholders, the scope rises.
Forecasting and analytics can be simple or advanced. Basic production forecasts may combine historical generation and weather APIs. More advanced models may use site-level conditions, asset degradation, market prices, load forecasts, and storage state of charge. That moves the project toward data science, model monitoring, and MLOps.
Security and availability are not optional in energy environments. Even read-only platforms need strong identity, audit logs, secure integrations, backup plans, and incident response. Systems that influence control decisions need a much higher bar.
For broader budget context, compare these drivers with the general model in Custom Software Development Cost. Renewable energy platforms follow the same product, design, engineering, QA, and support economics, but they add heavier device, data, and operational risk.
Feature Scope By Platform Type
A cost estimate becomes more accurate when you name the platform type. Four common patterns show up in renewable energy projects.
Solar or Wind Monitoring Dashboard
This platform tracks production, downtime, inverter or turbine health, alarms, and performance ratio. A first release usually includes asset hierarchy, trend charts, alert rules, daily reports, and role-based access. Cost rises when data must be near-real-time, asset counts are high, or the system needs mobile field workflows.
Energy Management System
An EMS helps operators understand generation, load, storage, grid exchange, and operating decisions. The MVP can start as read-only decision support. Later versions may add dispatch recommendations, control approval workflows, battery scheduling, market-price signals, and grid-event reporting.
Asset Performance Management Platform
APM software focuses on health, maintenance, reliability, and lifecycle economics. It connects alarms, work orders, fault history, spare parts, inspections, warranties, and downtime cost. This type of platform is more workflow-heavy than a pure dashboard.
Customer, Investor, or Compliance Portal
Some teams need a portal more than a control room. Customers want savings and carbon reporting. Investors want generation, availability, and financial summaries. Compliance teams need audit-ready exports. These portals can be cost-effective if they reuse a reliable internal data layer.
Renewable EMS Integration Architecture
A renewable energy management system is only as valuable as the data path behind it. Solar inverters, wind turbines, battery systems, smart meters, weather feeds, market signals, SCADA historians, CMMS tools, ERP systems, and reporting portals all describe the same operation from different angles. The software budget needs to include the work required to align those sources into one trusted operating model.
That is why an EMS estimate should separate integration from presentation. A dashboard card is straightforward when the data already has stable asset IDs, known units, freshness rules, and an owner. It becomes a larger engineering project when each site has different device naming, gaps in telemetry, inconsistent timestamps, or unclear authority between the plant system, historian, and cloud platform.
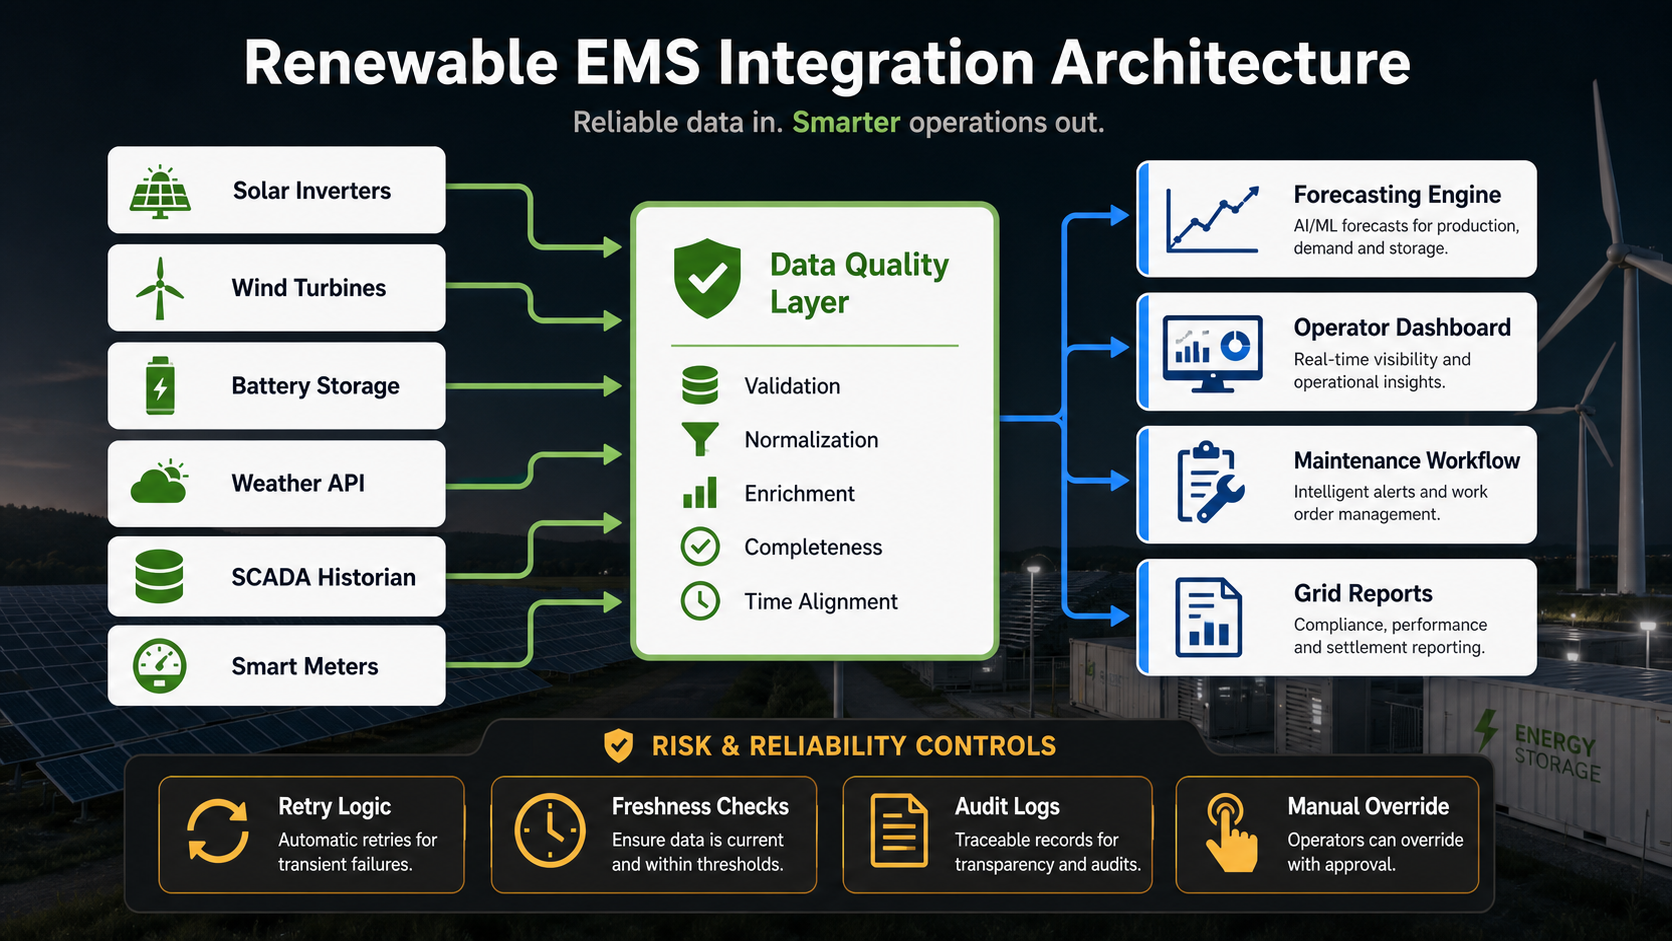
Use a layered architecture: source connectors, ingestion and retries, asset model, time-series storage, data-quality flags, analytics services, workflow APIs, dashboard screens, and audit/reporting exports. NextPage's custom dashboard development services are relevant when renewable operators need reporting tied to permissions, source labels, alerts, and decisions rather than disconnected charts. The Power BI vs custom dashboard app guide can also help decide whether the first release should be a BI layer, embedded analytics, or a purpose-built operating portal.
Integration And Data Architecture Costs
Integration scope is where renewable energy projects usually become either manageable or expensive. A clean MVP might import CSV files or pull data from one API. A production platform may need to connect to SCADA, PI historian, inverter APIs, smart meters, CMMS tools, ERP systems, GIS, weather providers, market data feeds, and cloud reporting environments.
Before estimating, list every source system and classify it into three groups: required for MVP, required before production rollout, and useful later. This avoids paying for low-value connectors before the product has proved its operating model.
Architecture choices matter too. Time-series energy data needs a different storage and querying strategy than normal transactional app data. High-volume telemetry may need streaming ingestion, data validation, retry queues, downsampling, observability, and cost controls. If existing applications or data stores need to move before the EMS can scale, connect the roadmap to cloud migration services and cloud performance optimization services early rather than treating infrastructure as an afterthought. If the software must serve many sites or many customers, include scalability planning early. NextPage's scalable software development services page covers the engineering decisions that become important when data volume, usage, and integration count grow.
Dashboards also need trust. Operators will stop using a screen if values are stale, unexplained, or inconsistent with the plant system. Build visible data-quality states into the product: last sync time, missing data warnings, confidence scores, and source-system labels. The same principle applies to any high-stakes reporting product, including analytics platforms like marketing analytics dashboards: the number is only useful when users trust how it was produced.
Forecasting, AI, And Analytics Scope
Forecasting can make a renewable energy platform far more valuable, but it should be phased carefully. Start with the question the forecast will answer. Examples include expected solar output, wind generation, battery state, maintenance risk, curtailment exposure, demand/load, grid congestion, storage state, or revenue impact. As variable renewable energy grows, forecast scope also needs governance: source data lineage, model confidence, override handling, model monitoring, and a record of whether recommendations improved decisions.
A lightweight forecast may use historical production, weather forecasts, seasonality, and simple regression models. That can be enough for planning and daily visibility. Advanced forecasting may require site-specific models, edge cases for outages and curtailment, battery degradation factors, confidence bands, human review, and model monitoring. This is where predictive analytics services become relevant: the model output needs to land in dashboards, alerts, approvals, and operating workflows, not a disconnected notebook. The budget then includes data science, validation, retraining, and explainability.
Do not add AI because competitors mention it. Add it when a human decision improves: which asset needs attention, when to schedule maintenance, how much production to expect, or whether a storage dispatch recommendation is worth reviewing. If your team is comparing custom forecasting against packaged tools, the build-vs-buy logic in Demand Forecasting Software for Retail and eCommerce is still useful: custom makes sense when your data, constraints, and decisions do not fit a standard product. For asset-heavy portfolios, the same telemetry and maintenance logic appears in predictive maintenance software with IoT and AI: predictions need failure modes, work-order context, and a review path before they change operations.
Flexibility And AI Forecast Governance Cost Stack
The 2026 cost conversation is shifting from "can we show renewable production?" to "can the software support flexible, trusted operating decisions?" IEA's Renewables 2025 outlook points to rapid renewable capacity growth alongside grid integration pressure, curtailment, storage, and flexibility needs. IRENA's 2026 digitalisation and AI power-system cases point in the same direction: monitoring, forecasting, operational optimisation, automation, and transparency are becoming core software capabilities rather than optional analytics extras.
That does not mean every renewable platform needs a large AI build on day one. It means the estimate should separate the layers. Clean telemetry, asset hierarchy, source labels, and historical data come first. Flexibility signals such as weather, grid events, storage state, load, curtailment, and market constraints come next. Only then should the team fund forecast models, confidence bands, human override flows, model monitoring, and operating workflows. When the AI layer is real, connect it to machine learning development services as production software, not a disconnected notebook.
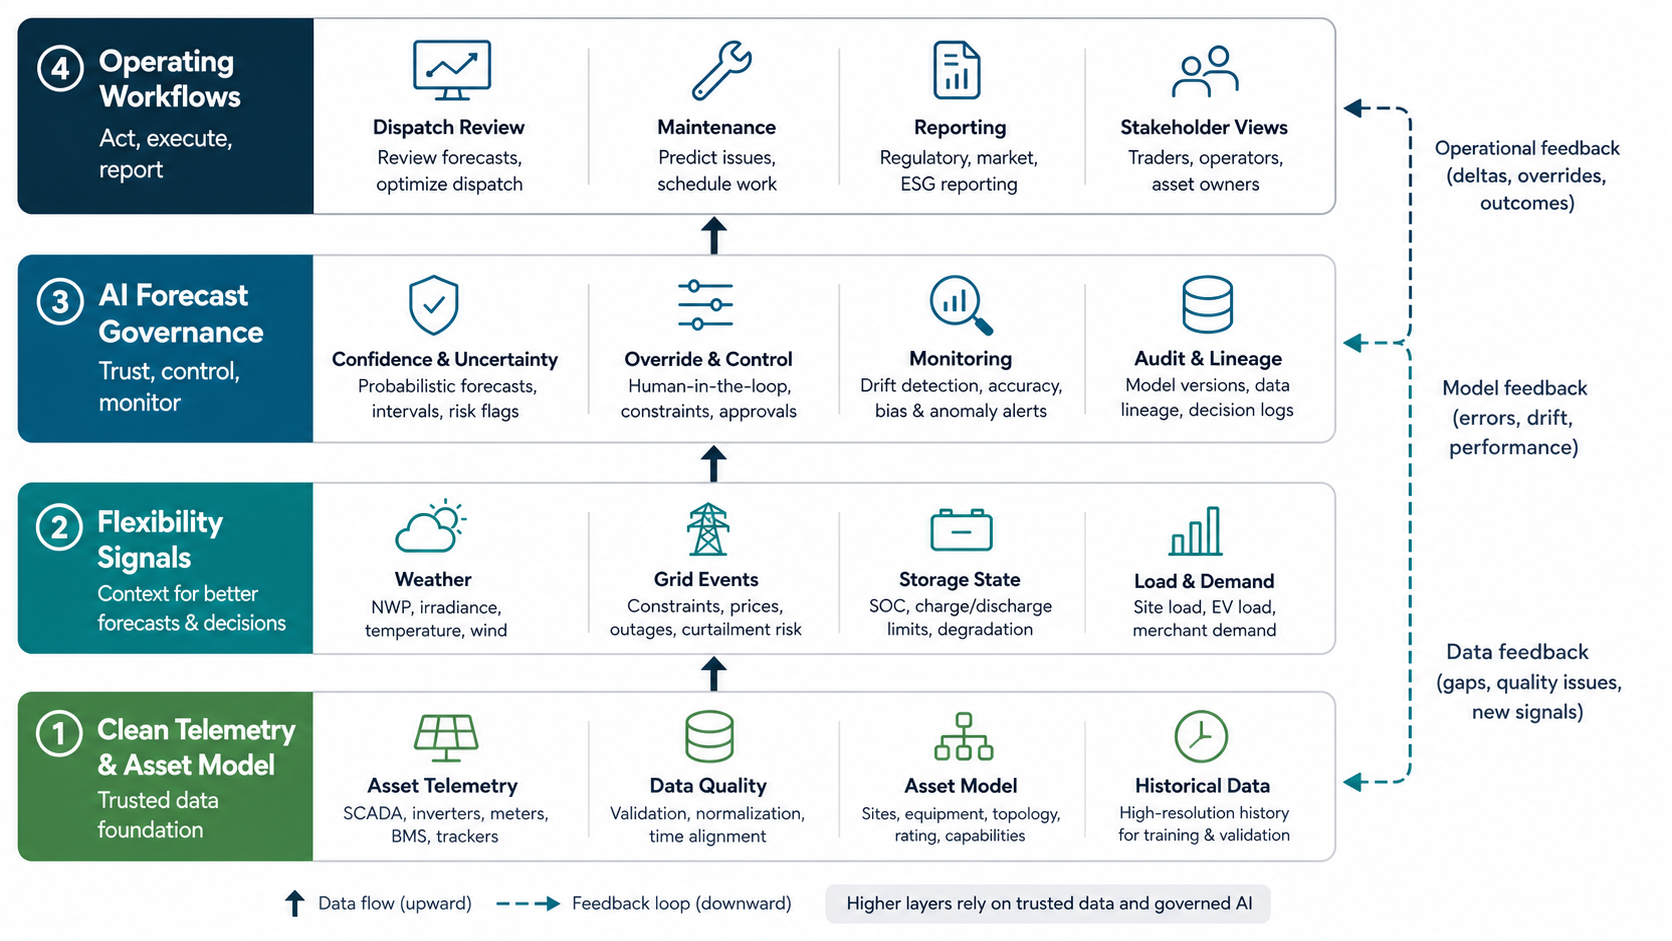
The same stack changes the build-vs-buy decision. If a packaged EMS already handles the required site types, device contracts, storage rules, and reporting obligations, buy and integrate. If your portfolio has unusual asset topology, tariff logic, dispatch review, investor reporting, or field workflows, custom software may be the safer long-term path. For connected assets and telemetry-heavy products, pair the estimate with IoT app development services planning so device data, cloud services, dashboards, alerts, QA, and support ownership are designed together.
Security, Compliance, And Reliability
Renewable energy systems may start as monitoring tools, but they often sit close to operational infrastructure. That means security planning should be built into the estimate, not bolted on at the end.
At a minimum, plan for single sign-on or strong authentication, role-based permissions, audit logs, encrypted secrets, secure API access, environment separation, backup and restore, vulnerability management, and clear incident response. The DOE Distributed Energy Resource Cybersecurity Framework and NIST Smart Grid Profile both reinforce that DER security is a system risk-management problem across devices, networks, vendors, identities, and operating processes. If the platform touches control workflows, grid-sensitive data, or AI-assisted operating recommendations, add stricter network segmentation, approval flows, vendor access control, model-output review, incident evidence, and more formal testing.
Reliability also affects cost. A monthly investor report can tolerate delayed data. A control-room dashboard cannot. Define uptime, latency, data freshness, support ownership, recovery testing, and incident evidence in plain language before engineering begins. That one conversation can prevent a low estimate from hiding a high-risk production obligation.
Renewable Software Rollout Control Board
The safest cost plan prices the first operating decision, then expands only after the platform proves data trust and user adoption. Renewable projects fail when teams fund enterprise automation before they know whether operators trust the telemetry, whether reports reconcile with source systems, and whether recommendations are reviewed at the right moment.
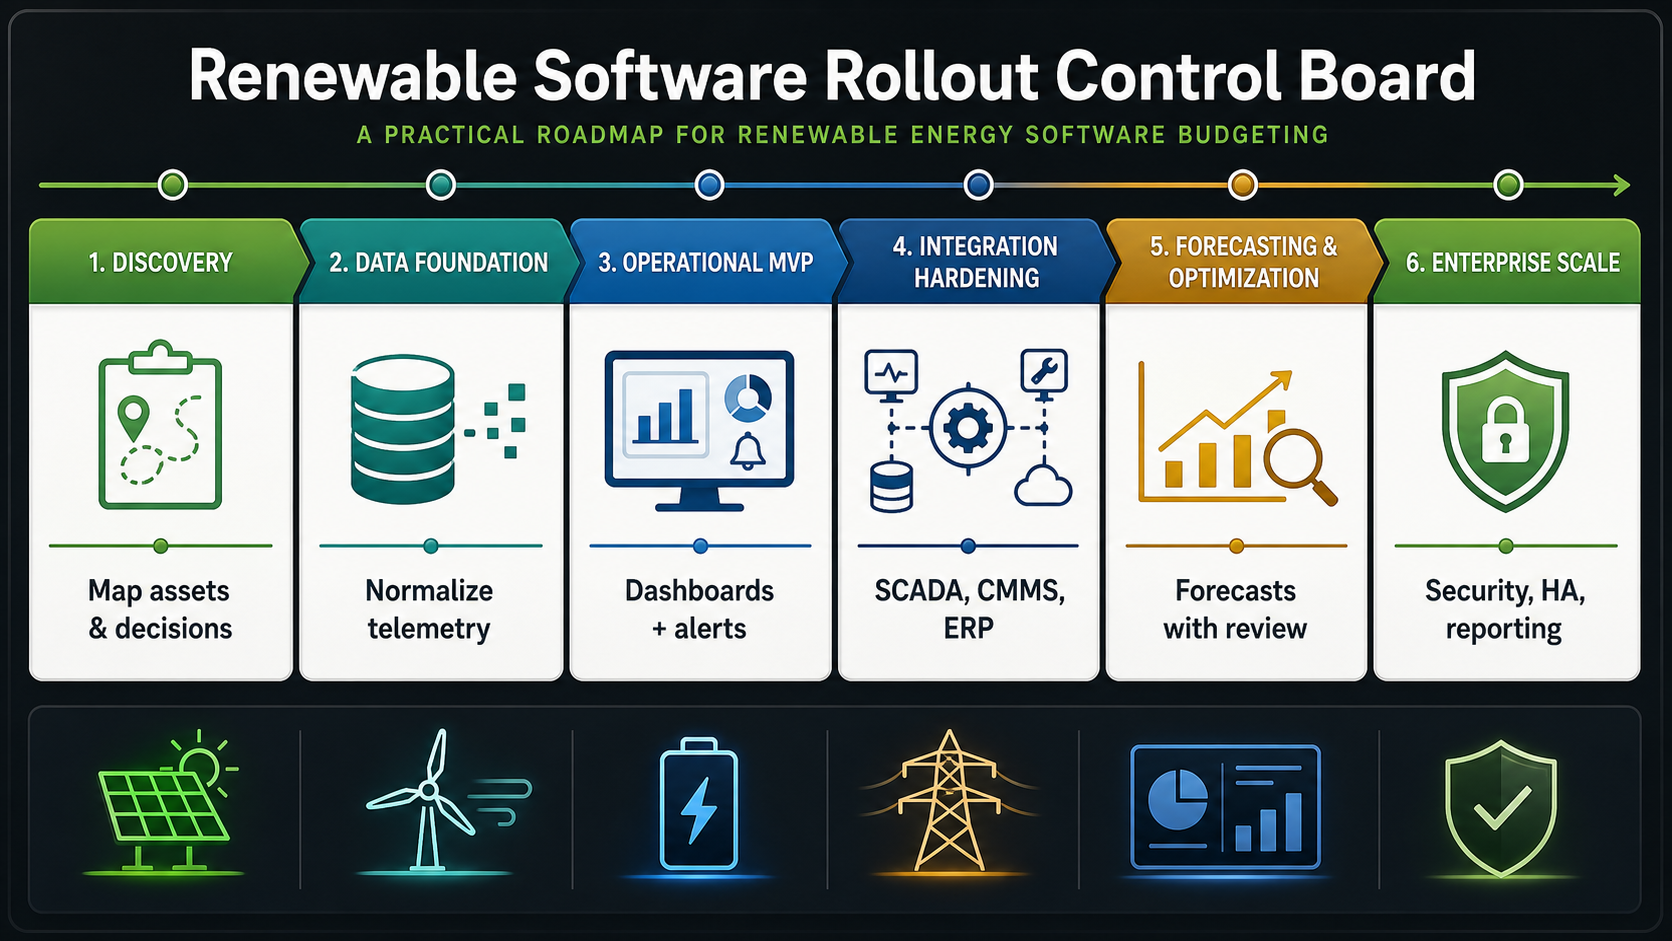
| Stage | Build Focus | Budget Gate |
|---|---|---|
| Discovery | Map assets, source systems, users, reports, protocols, and target decisions. | Which operating decision has the clearest cost, uptime, or reporting value? |
| Data Foundation | Normalize asset IDs, telemetry, timestamps, quality flags, and ownership rules. | Can operators explain and trust the numbers on screen? |
| Operational MVP | Launch dashboards, alerts, exports, roles, and manual workflow handoff. | Does the MVP reduce spreadsheet work, delayed reporting, or missed exceptions? |
| Integration Hardening | Add SCADA/historian, CMMS, ERP, weather, market, and reporting connectors. | Do retries, audit logs, and support ownership exist for every critical connector? |
| Forecasting And Optimization | Add forecasts, anomaly detection, battery/dispatch logic, and reviewed recommendations. | Do model outputs include confidence, override, and outcome tracking? |
| Enterprise Scale | Harden security, high availability, observability, multi-site governance, and grid reporting. | Can the platform support more sites without increasing manual operations? |
The EV fleet energy management software roadmap is a useful adjacent pattern: energy software becomes valuable when it connects asset state, constraints, schedules, exceptions, and business reporting into one operating loop.
A Practical MVP-To-Enterprise Roadmap
The safest way to control renewable energy software cost is to phase the platform around decisions, not departments.
- Discovery and data audit: inventory assets, source systems, users, reports, protocols, refresh rates, and data gaps.
- MVP dashboard: show the core asset model, production trends, alerts, and the one or two reports that save the most manual effort.
- Workflow layer: add triage, notes, assignments, work-order handoff, report approvals, and stakeholder portals.
- Forecasting layer: introduce weather-aware forecasts, anomaly detection, downtime prediction, or revenue scenarios once historical data quality is proven.
- Enterprise rollout: harden security, scale ingestion, add multi-site governance, improve audit trails, and expand integrations.
This approach keeps the first budget focused while still giving the architecture room to grow. Connected assets also need field-pilot discipline similar to the IoT mobile app development roadmap: confirm device contracts, telemetry delays, support diagnostics, and field exceptions before scaling automation. It also makes vendor comparison easier because every proposal can be judged against the same release sequence.
Build Vs Buy: When Custom Software Makes Sense
Buying is usually faster when your requirements fit a standard monitoring, EMS, or APM product. If you need common dashboards, standard inverter integrations, basic ticketing, or simple customer reports, start by evaluating existing platforms.
Custom software makes more sense when the operating model is differentiated. Examples include multi-vendor assets with inconsistent data, unique investor reporting, proprietary optimization logic, local regulatory workflows, custom tariff or market calculations, unusual field-team processes, or a customer-facing product that must become part of your business model.
If you pursue custom, evaluate partners carefully. For differentiated operating software, use custom software development when packaged products cannot match your data model, workflows, reporting obligations, or customer-facing product strategy. A renewable energy software vendor should understand data pipelines, device integration risk, cloud architecture, QA, security, and long-term support. Use the questions in the Custom Software Development Company Checklist to pressure-test estimation quality, not just hourly rates.
Estimation Checklist Before You Fund The Build
Use this checklist before approving a renewable energy software budget:
- Which operating decision will improve first: monitoring, forecasting, maintenance, reporting, dispatch, or customer visibility?
- Which assets, sites, and user roles are in the first release?
- Which source systems are required for MVP, and which can wait?
- What data refresh rate is actually needed for each screen?
- Will the platform be read-only, recommendation-based, or connected to control workflows?
- What security, audit, uptime, and support obligations are non-negotiable?
- Which reports or workflows currently consume the most manual effort?
- What proves ROI in the first 90 days after launch?
- Which integrations have unknown access, licensing, protocol, or data-quality risk?
- How will the platform expand if the first site or portfolio succeeds?
Once these answers are clear, your estimate becomes a scope model rather than a guess. NextPage can help turn that model into a phased backlog, architecture plan, and implementation estimate tied to the Custom Software Cost Estimator.
Next Step: Price The First Operating Decision
Do not estimate renewable energy software as a fixed page count. Estimate the first operating decision the platform must improve, the data sources needed to support it, the reliability bar for that decision, and the evidence required before expanding the roadmap.
NextPage can turn that decision into a phased backlog, architecture plan, and implementation estimate. Start with the Custom Software Cost Estimator, then use the scope conversation to decide whether the first release is a dashboard, EMS workflow, forecasting pilot, reporting portal, or enterprise platform foundation.